Linea Mercati Interview 10/7/24
October 8, 2024Linea Mercati Interview 10/8/24
October 9, 2024TECHNICAL OUTLOOK & STATISTICS
GIANPAOLO RAFFO | October 2nd, 2024
PERFORMANCE GLIMPSE
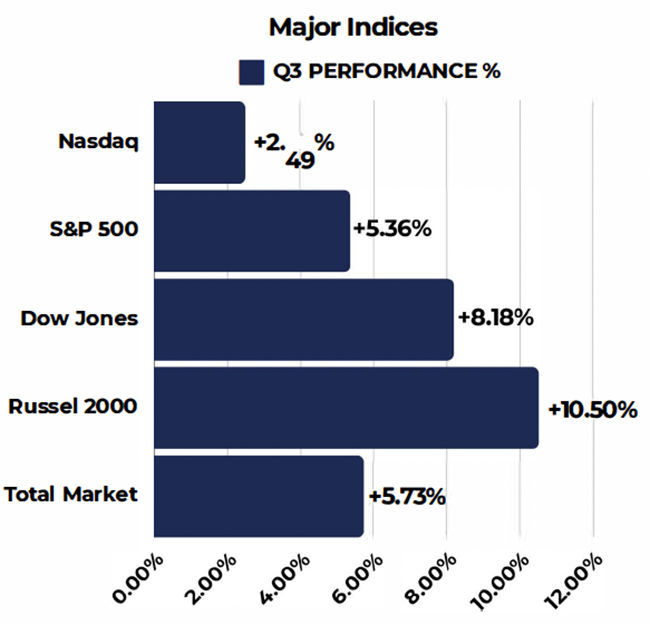
As the second quarter concluded on Monday, September 30th, this report aims to break down sector and index performance to better understand momentum and sentiment and may provide insight to the fourth quarter of 2024. In this overview, major indices, sentiment, momentum, volatility and sector specific performance will be discussed with key statistics and visualizations of market movement to summarize Q3 of 2024.
S&P Sector Overview
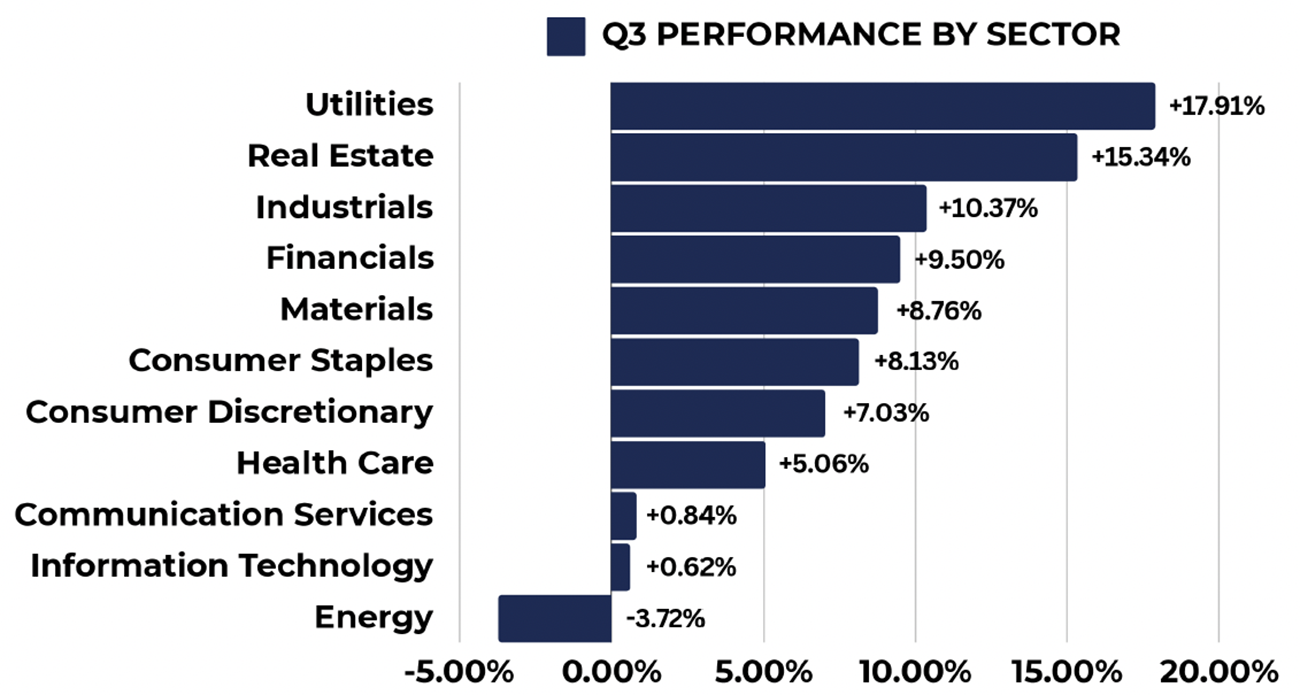
The chart above includes S&P Indexes by Sector and their quarterly performance for Q2 2024 ...
- • Leading sectors for the quarter include Utilities, Real Estate, and Industrials, all of which concluded the quarter with strong gains at or above 70%, Utilities being the leading sector with 77.97% gains.
- Other sectors with positive performance but slightly lower than the leaders for Q3 include Financials, Materials, Consumer Staples, Consumer Discretionary, and Health Care all with positive performance between 5%-9.5%
- • Lagging sectors for the second quarter include Communication Services Information Technology, with nearly flat gains just below 7%. Lastly is Energy being the only negative sector for the quarter.
- Communications and Information Technology were leading sectors last quarter, but have now cooled off in the most recent quarter as sector rotation and profit taking within these equities was observed.
S&P 500 Index - SPX
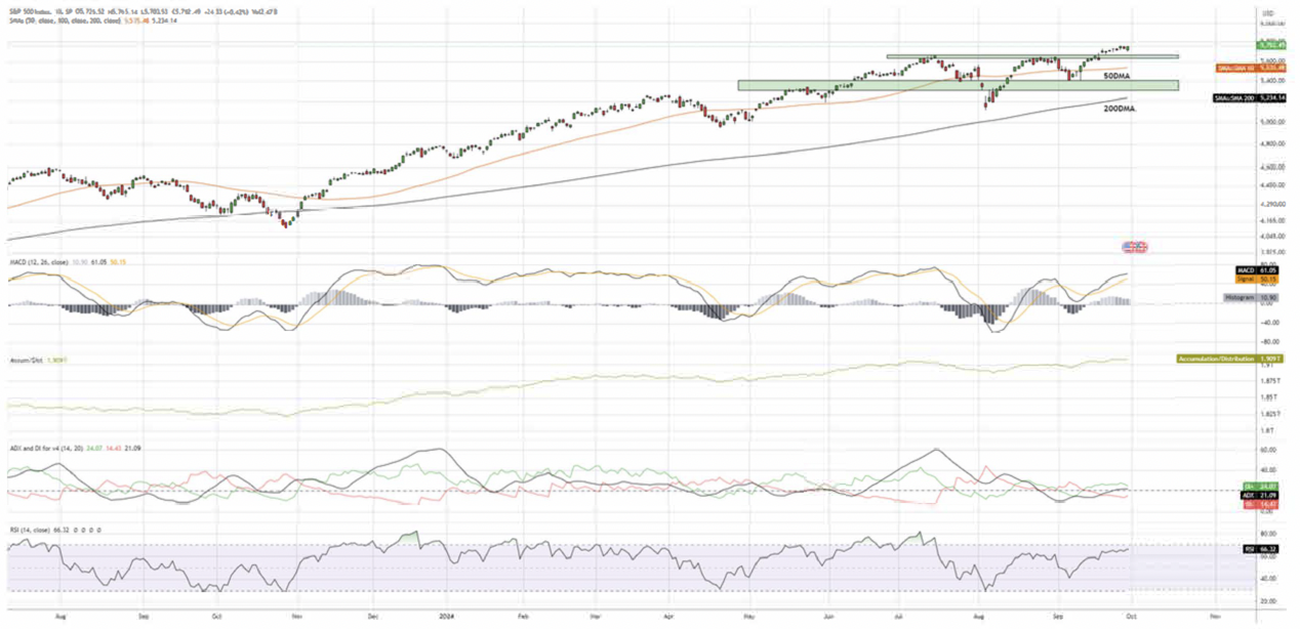
The S&P 500 closed at 5,762 for the third quarter of the year, posting a gain of +5.36% for the quarter, the third-best performing index behind the Russel and Dow Jones. Despite two-sharp declines in August and September, the index remained resilient in recovering from these lows. With the index sitting at all-time highs, a retest in the short-term of the 5,650 level is likely a support level as technical indicators suggest a non-trending market in the short-term. Seeing this area had difficulties being breached above in both July and August, a successful retest of this key level would give investors further confidence on a technical basis.
Key Technicals
-
Support levels for the S&P are respectively 5,650, followed by 5,500 near the SO-Day Moving Average, as well as within the 5,350-5,410 range as a key demand zone. ADX is suggests a non-trending market. Ace/Dis indicator shows positive inflows.
-
MACD is currently suggesting positive momentum, but seems to be flattening out which may result in a short-term momentum shift to the downside to retest the key 5,650 level. As earnings approach, this will be a key fundamental catalyst.
Dow Jones Industrial Average - DJI
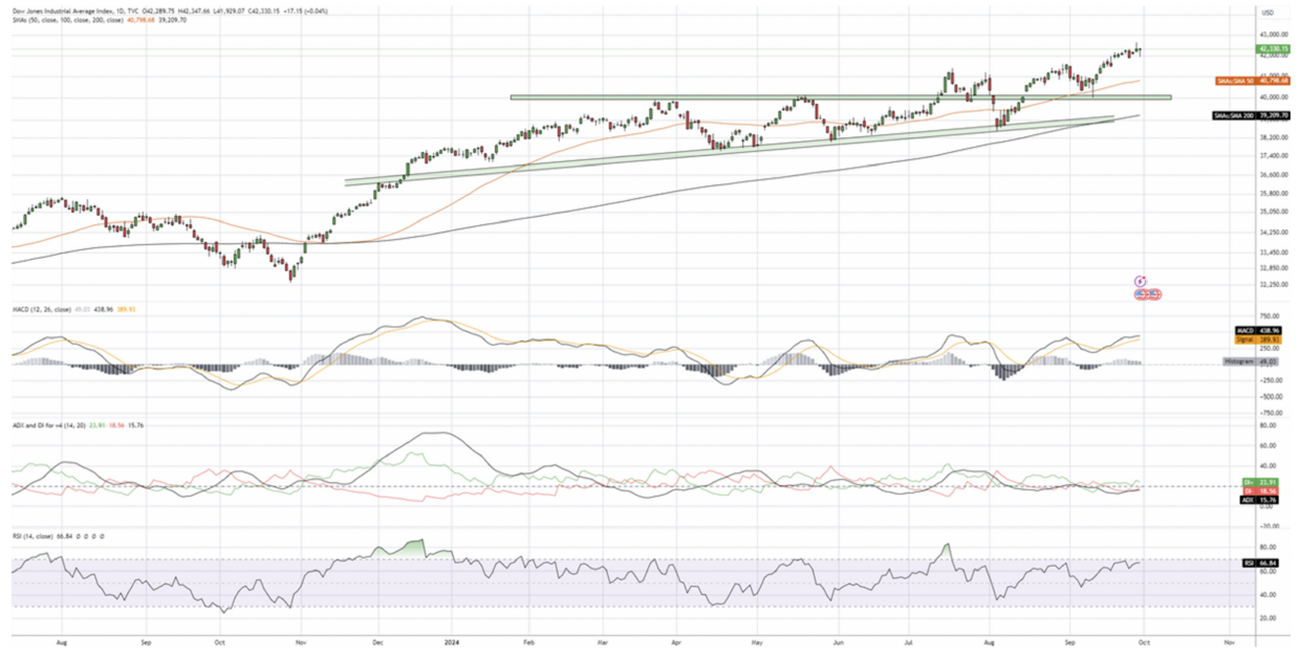
The Dow Jones finished the second quarter slightly lower than the Russel as the runner-up in terms of performance, posting 8.18% gains for Q3. After struggling to breach above the 40,000 level twice in Q2, the Dow currently sits slightly off all-time-highs as the index successfully breached above 40,000, retested, and rallied towards 42,000, a positive indication of technical strength.
Key Technicals
- • Support levels for the Dow are respectively 41,575, followed by 40,835 where the SO-Day Moving Average is seen above. Following these support levels, 40,000 acts as key support but a move to these levels is unlikely.
- • MACD similarly to the S&P is showing a flattening out, along with candlestick patterns near this level showing indecision.
- In the short term, the Dow may see a flat "give and take" trading range before earnings season approaches, which will likely be the key catalyst of determining direction of this specific index.
- As large-cap equities lagged behind in Q3, earnings from key companies will determine whether the Dow continues its rally.
Nasdaq - IXIC
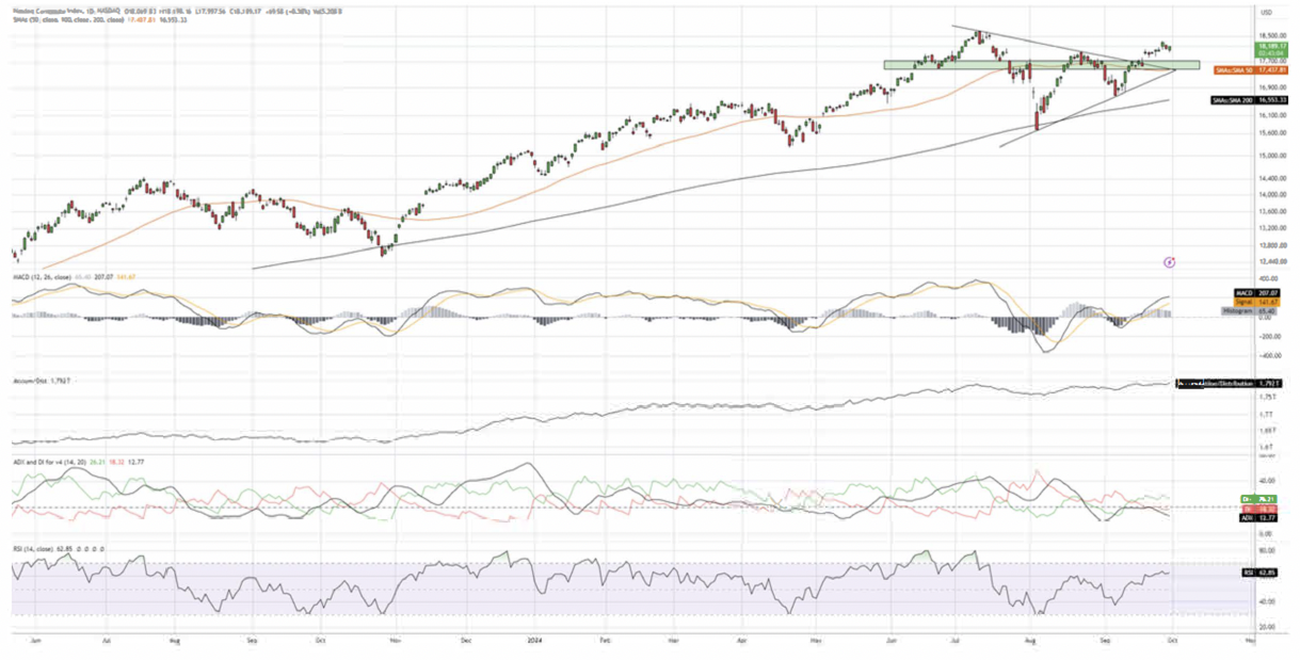
The Nasdaq closed at 18,158 as the lowest performing index for the quarter, but up +2.49% from Q2's close. Similar to its counterparts, the index shows a non-trending market as well as flattening within the MACD indicator. Considering the focus on trending tech stocks in the previous quarter which attributed significantly to the Nasdaq's performance, a volatile trading range within recent months has taken place. As seen above, the Nasdaq formed a bullish pennant that it was able to breakout of in recent weeks and is likely to retest the 17,600 - 17,700 area before continuing a run back towards all-time highs.
Key Technicals
-
Support zones for the Nasdaq are the 17,600-17,700 area where the most recent breakout occurs, followed by the 17,400 area as support along the SO-Day Moving Average. The 200-Day Moving Average sits near 16,550 but is unlikely to move here.
-
With a positive reaction to earnings announcements in the coming weeks, the Nasdaq is likely to return to record highs.
-
ADX does not signal a trending market, but positive inflow and directional movement is seen, a good sign for the index.
Russel 2000 - RUT
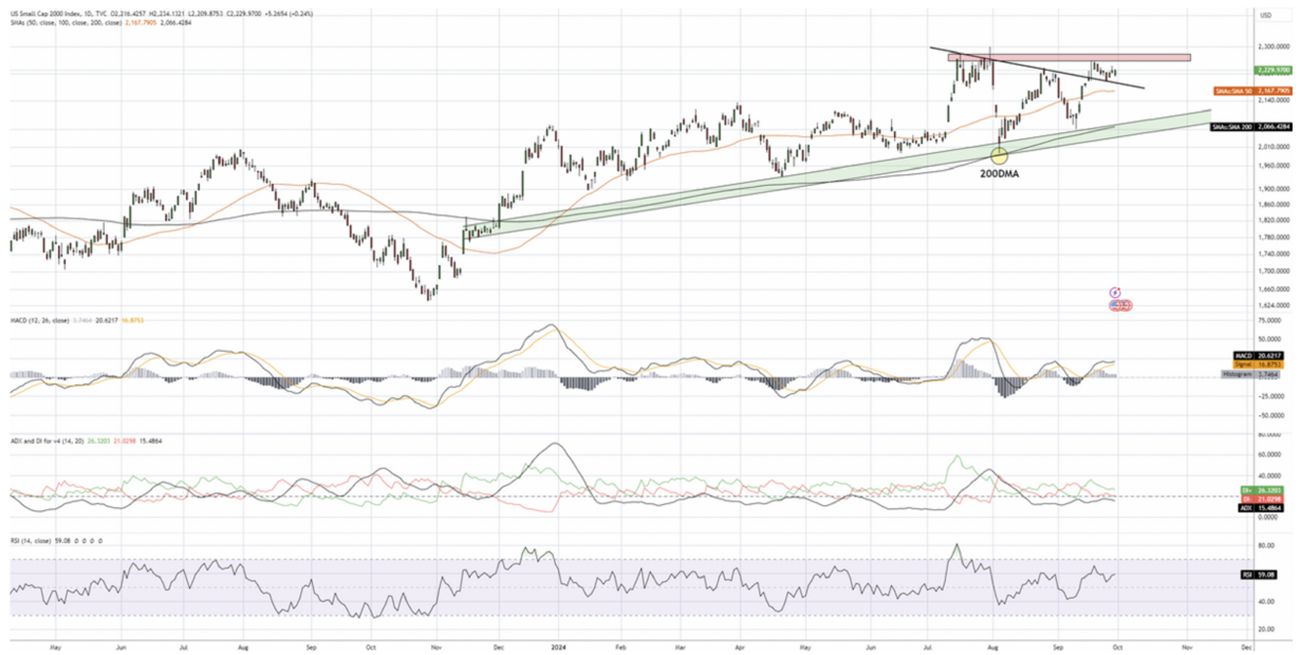
The Russel 2000 posted the largest gains for the quarter in comparison to the other indices, up 10.50% from Q2 close. This is attributed to the small-cap inflows for the quarter being the best performing in terms of market capitalization, as well as catching up to other indices from last quarter as predicted in the previous overview. The Russel has formed a bullish pennant which in recent days it has broken out from. Seeing a reversal along the top of the pennant would be a positive sign of bullish continuation, as well as the resistance level of2,275 being pierced through.
- •Support zones for the Russel are near 2,100 along the upward sloping trend line, as well as near 2,167 near the 50-DMA.
- Technical indicators for the Russel show some indecision at current levels, but the recent break out as well as the approach of earnings season may make this short-term period of indecision brief for the index.
- In comparison to other indexes, the Russel has outperformed for the quarter with continued upside for Q4, likely to see the index over 2,300 within the following months.
Volatility Statistics
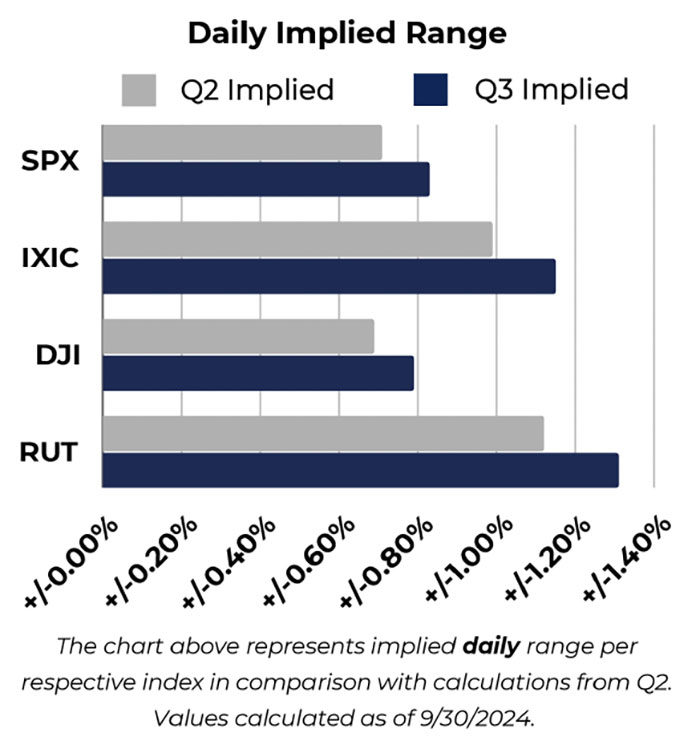
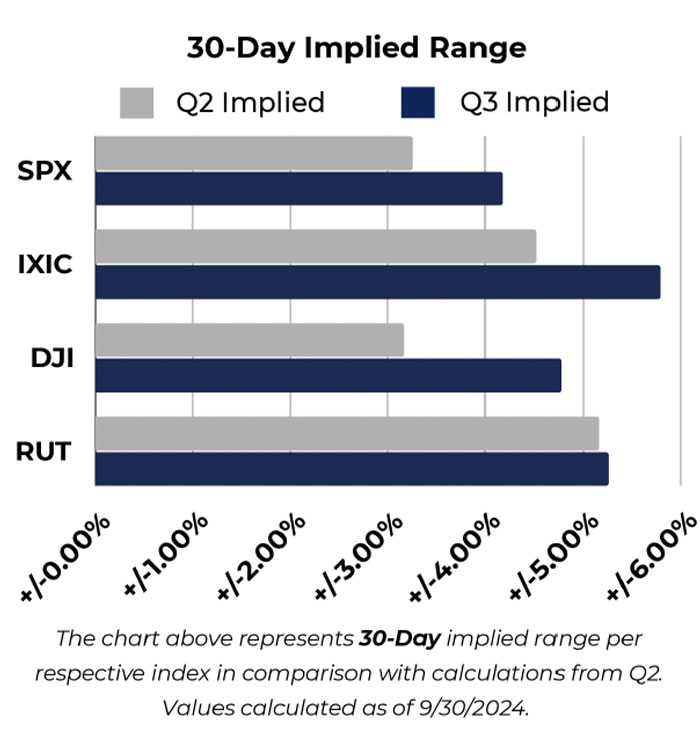
Looking at volatility in the major indices, the visuals above show underlying volatility index calculations to estimate daily implied ranges as well as 30-Day implied ranges. Calculations from the previous quarter can be seen for comparison, represented by the grey colored bars. Q3 calculations are shown in the blue bars.
- In comparison to the previous quarter, implied range through volatility for all major indices is higher, suggesting increased volatility in equities on an intraday and 30-Day forward looking basis.
- Using the most recent volatility metrics, the Russel is expected to be the most volatile index on an intraday basis, and the Nasdaq shows the highest implied volatility on a 30-Day forward looking range.
- The S&P 500 30-Day implied volatility is the lowest among the indices, while the Dow daily implied volatility suggests the lowest volatility on an intraday basis.
Sentiment Statistics
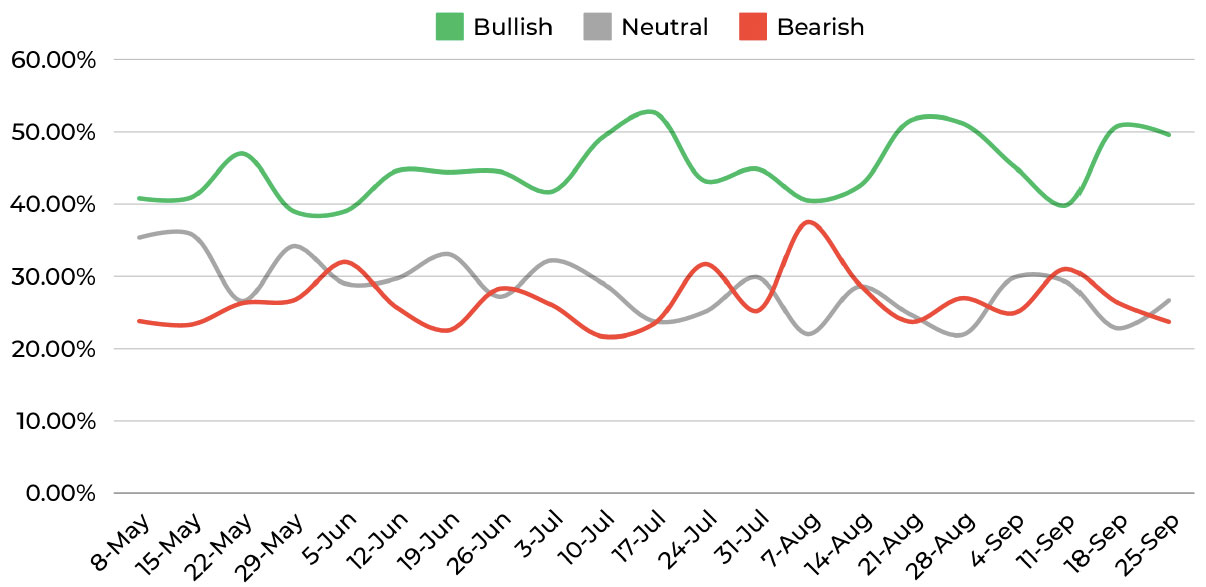
The chart above is a collection of weekly sentiment readings from the American Association of Individual Investors (AA/I}, gauging investors outlook on equity markets for the following 6 months. www.aaii.com/sentimentsurvey
Looking at other key metrics that measure sentiment and momentum, the most recent sentiment survey (conducted on 9/25/24) shows investor confidence remains bullish in the majority and has remained above 40% for most of 2024. This is above the historical average of 37.5% for bullish sentiment. We saw a rise in bearish sentiment during the beginning of August as equities sharply fell, but their quick recovery reversed sentiment rapidly back to bullish confidence. Resilience in equity markets and investor confidence remaining slightly above historical averages (but not at extreme levels) is a positive indication of market strength.
Momentum Statistics
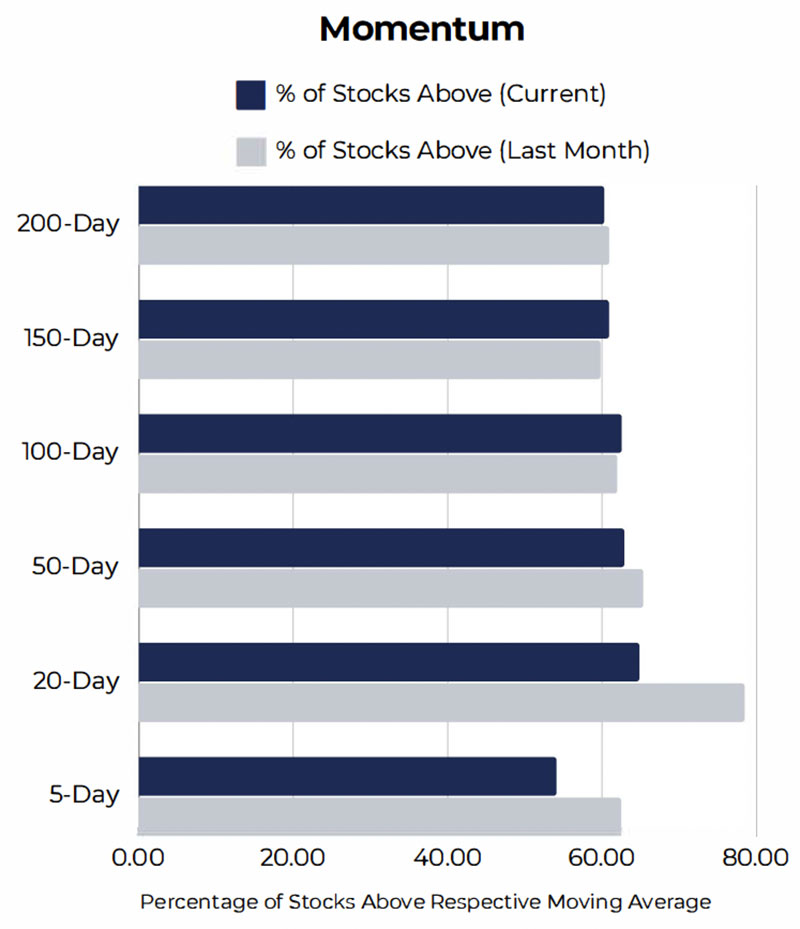
Included on the left are percentages of stocks that remain above their respective moving averages. In order to further gauge market internals, we can compare the most current reading to data from the prior month. When high percentages of stocks are above their respective moving averages, it is a positive sign that a market uptrend is valid.
- • Momentum in the long-term averages is mostly unchanged, where we see more of short-term averages (5 and 20 DMA's) losing some steam.
- • Equities have been resilient in maintaining their upward trend in recent weeks, and we have seen multiple V shaped recoveries throughout the quarter.
- As some equities lose momentum in the short-term, long-term averages remain unchanged.
Values calculated as of9/30/2024.
Committed to seamlessly delivering strategic financial solutions with intelligence, discipline and integrity.
Spartan Capital Securities, LLC is a full-service, integrated financial services firm that provides sound investment guidance for high net worth individuals and institutions. Our in-depth market knowledge, calculated risk management strategy and investment acumen have earned us a strong reputation as trusted Financial Advisors.
Our philosophy is simple: Understand our clients' objectives and execute accordingly. Our experienced investment professionals provide highly customized personal service, tailoring an asset allocation program to enable each client to meet their financial goals.
Disclosure
This report has been prepared as a matter of general information regarding market conditions, it is not a complete description of any security or company mentioned and is not an offer to buy or sell any securities. All facts and statistics are from sources believed reliable, are not guaranteed accuracy. Transactions may be effected which are inconsistent with research reports. The views expressed herein accurately reflect personal views.
-
This is not an offer to sell or the solicitation to buy any security in any jurisdiction where such offer or solicitation would be legal.
-
Clients should consider whether any advice or recommendation is suitable for their particular circumstances and, if appropriate, seek professional advice, including legal and tax advice.
-
The information is deemed to be defined as Technical Analysis and is not defined as a Research Report under Rule 2241.
45 Broadway, 19th Floor New York, NY 1006 | Tel 212 293 0123 | 877 772 7818 | Fax 212 785 4565
www.spartancapital.com | Member of Finra | SIPC | MSRB Registered