Linea Mercati Interview 1/9/26
January 12, 2026Wall Street indexes gain with tech, Walmart
January 12, 2026GIANPAOLO RAFFO - TECHNICAL MARKET STRATEGIST | JANUARY 9, 2026
Performance Glimpse
The fourth quarter of 2025 concluded on Wednesday, December 31st. This report breaks down sector and index performance to better understand momentum, sentiment, and may provide insight to the 2026 fiscal year. In this overview, major indices, precious metals, momentum, volatility, sector specific performance, and sentiment will be discussed with key statistics and visualizations of market movements to summarize both Q4 and annual performance.
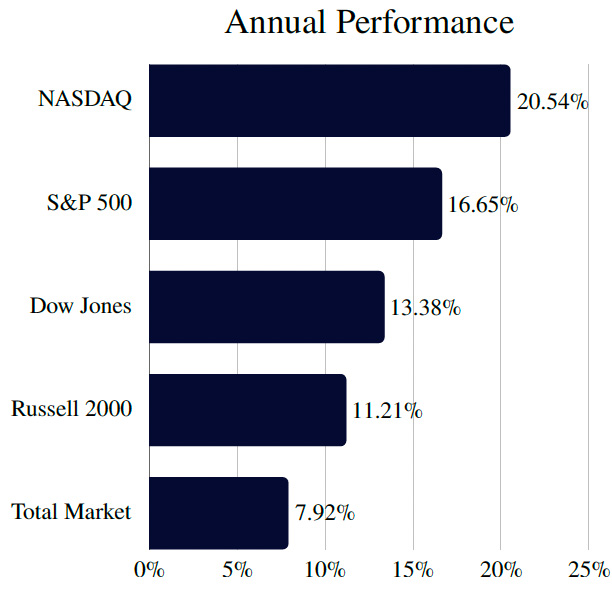
Equities delivered a resilient performance during 2025, showing impressive recovery from March and April volatility with all major indices posting significant gains for the year, led by the technology and growth sectors. The Nasdaq was the clear leading index, surging by 20.54%. This was followed by the S&P 500 which climbed 16.65%, reflecting the strong performance of large-cap equities. Meanwhile, the Dow Jones Industrial Average and the Russell 2000 also saw solid increases in a broad-based rally, rising by 13.38% and 11.21%, respectively. Overall, the year showed a preference for large-cap growth, with the Nasdaq significantly outpacing both value oriented blue chips and small-cap stocks.
The year was defined by the dominance of large-cap growth, represented by the Nasdaq’s 20.54% surge and the S&P 500’s 16.65% gain. Despite midcap’s outperforming up until September, large cap’s quickly became the leader by year end as a shift to value and quality was apparent in the fourth quarter. This can also be attributed to profit taking within growth technology and AI related equities that shined throughout 2025 as the market weighed valuations, leading to rotation after a strong year of gains.
Comparative Index Performance
This section provides a comparative look at performance for each quarter to visualize market trajectory in regard to major indices including the NASDAQ, S&P 500, Dow Jones Industrial Average, and the Russell 2000 in 2025.

After a volatile spring in March and April where equities declined and volatility spiked, Q2 and Q3 were evidently the strongest quarters of 2025. In the fourth quarter specifically, equities maintained positive momentum with all major indices posting gains led by blue-chip and industrial stocks. The Dow Jones, representing large-cap industrial and value companies, rose by 3.59%, the clear leader for the quarter. This was followed by the Nasdaq which climbed 2.57% as technology and growth sectors continued their upward trajectory. Meanwhile, the broader market saw more modest increases to close the year, with the S&P 500 advancing by 2.35% and the Russell 2000 rising by 1.86%. Overall, the quarter showed a distinct rotation into value, with the Dow Jones notably outpacing the Nasdaq and the small-cap Russell.
Comparative Index Performance
The following charts illustrate five-year performance of the U.S. indices, these visualizations represent annual performance of the primary benchmarks, highlighting differences between growth and value sectors.
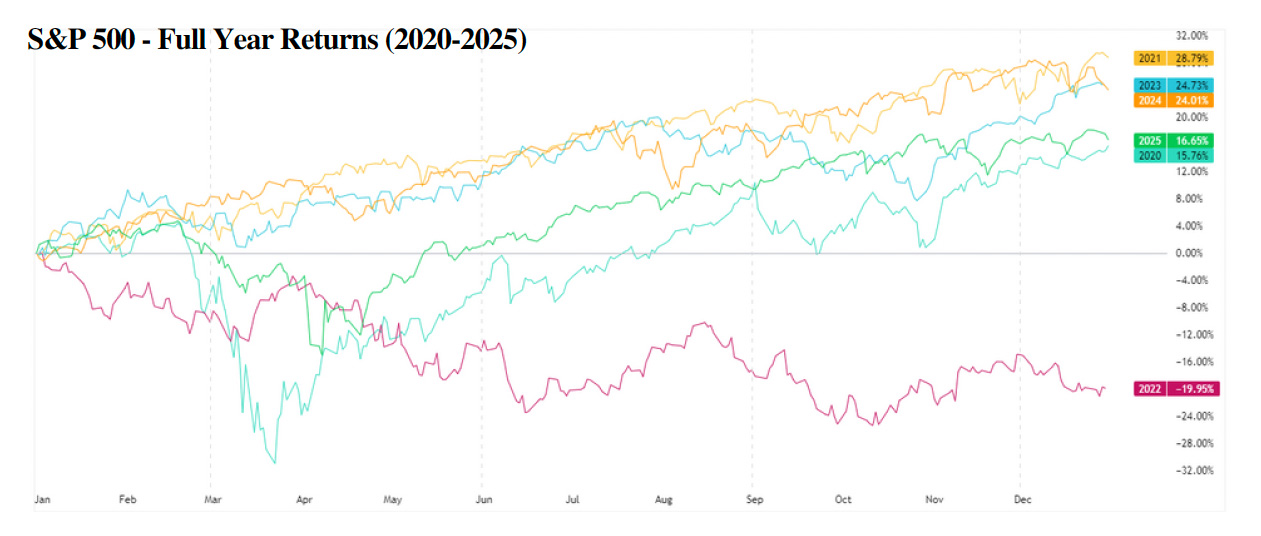
The S&P returned above average gains at 16.65% for 2025, significantly stronger than the 10-year average of 12.8%, as well as higher than it’s 20-year average of 9.7%.

The Nasdaq returned above average gains at 20.54% for 2025, significantly stronger than the 10-year average of 14.3%, as well as higher than its 20-year average of 10.8%.
Comparative Index Performance
The following charts illustrate five year performances of the U.S. indices, these visualizations represent annual performance of the primary benchmarks, highlighting differences between growth and value sectors.
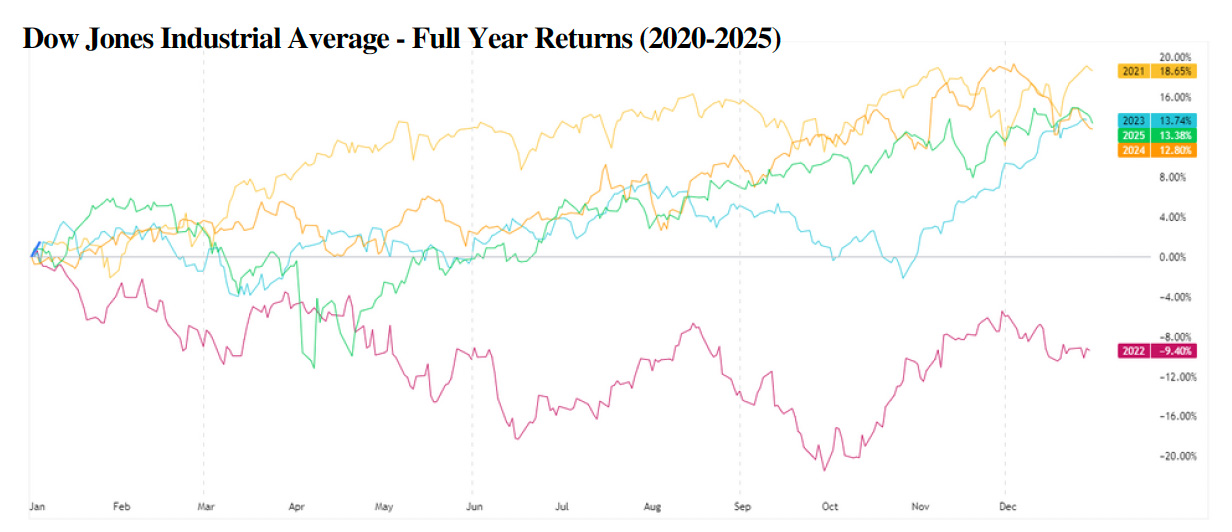
The Dow Jones returned above average gains at 13.38% for 2025, significantly stronger than the 10-year average of 11.5%, as well as higher than its 20-year average of 10.2%.
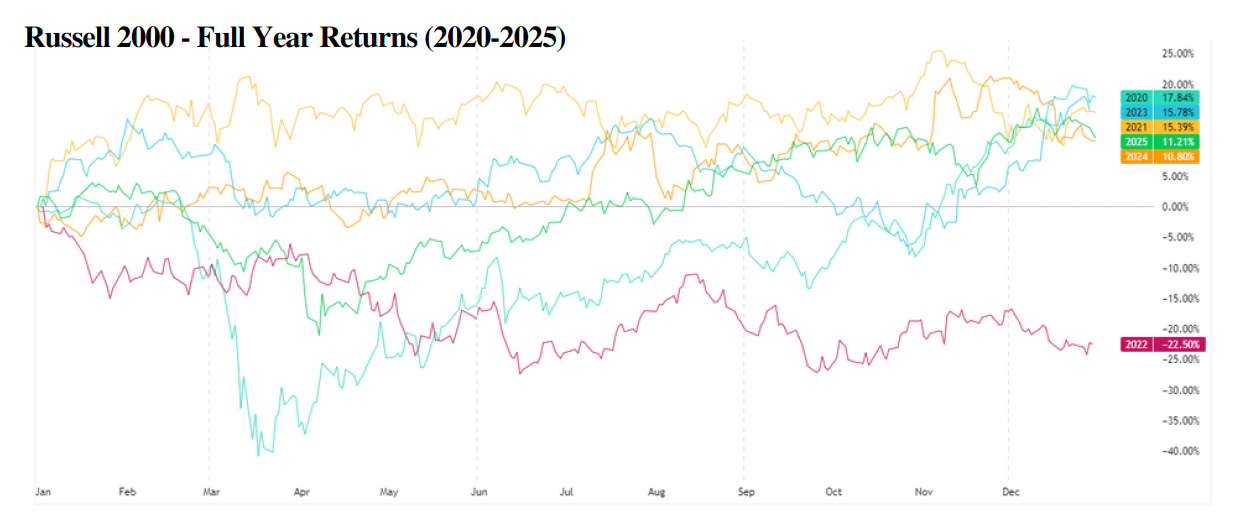
The Russell 2000 returned above average gains at 11.21% for 2025, significantly stronger than the 10-year average of 8.1%, as well as higher than its 20-year average of 8.3%.
Sector Review - Quarterly
The transition into the final quarter of the year brought a significant reshuffling of sector focus, and a shift in investor sentiment as the year drew to a close. Communication Services maintained its position as the market leader, though its momentum slowed from a 14.0% surge in Q3 to 8.7% in Q4. The largest downturn was seen in Utilities, which dropped from a 3.9% gain to a -4.9% loss. Other notable shifts include the Consumer Discretionary sector, which moved from a nearly flat -0.1% dip in Q3 to a 2.6% gain in Q4, and the Energy sector’s steady climb from 3.7% to 6.0%. Meanwhile, the Information Technology sector saw its earlier growth nearly stall, cooling from a 7.1% increase in Q3 to just 0.3% by the end of the year.

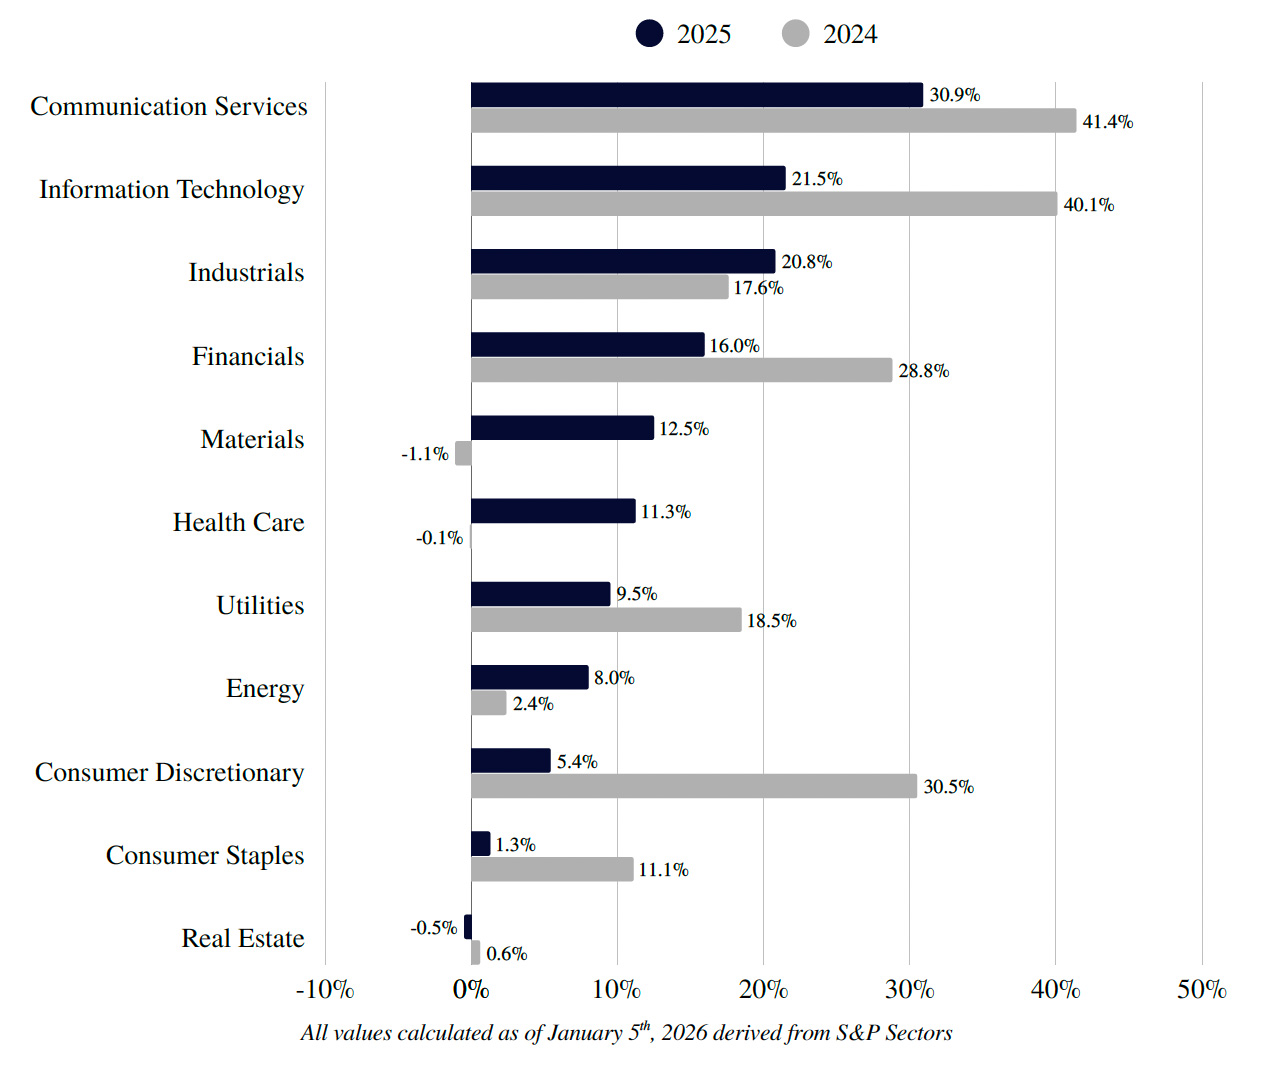
Sector Review - Annual
This section provides a comparative look at sector performance between 2024 and 2025. While the market's upward trend overall continued, these shifts indicate a clear rotation. Communication Services cooled from a 41% gain in 2024 to 30.9% in 2025, it remained the top performer. The most dramatic reversal occurred in Consumer Discretionary, which fell from a 31% gain to just 5.4%. Other key turnarounds include the Materials sector, which rebounded from a -1% loss to a 12.5% gain, and the Energy sector's recovery from 2% to 8.0%. The Information Technology sector saw its momentum slow from the prior year, falling from a 40% gain to 21.5% but still remaining the top performer.
Precious Metals
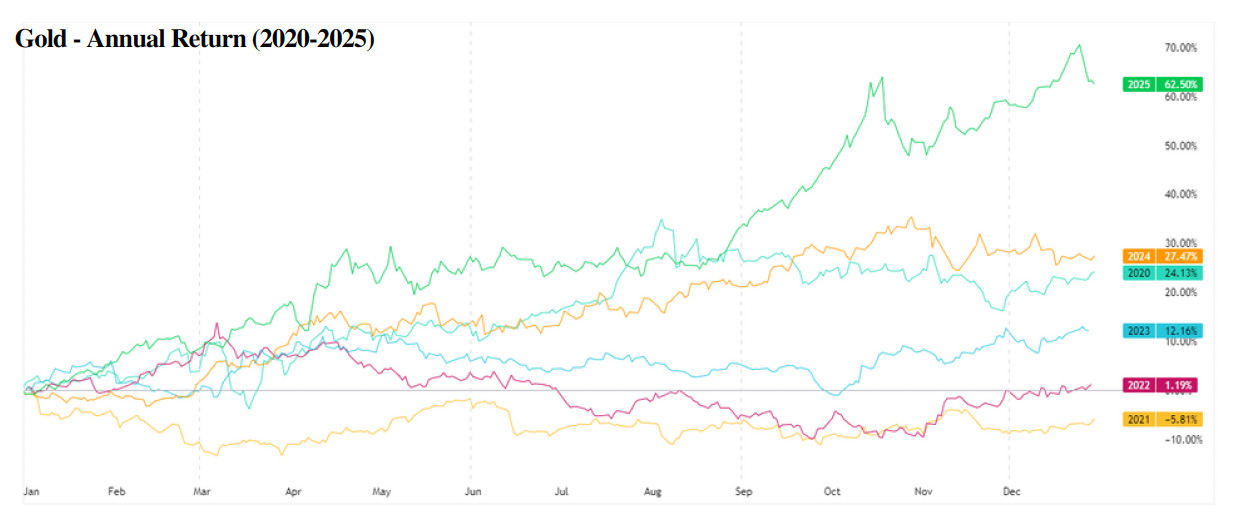
In the final quarter of 2025, the precious metals market moved from a broad rally into a phase of historical record breaking movement. While gold finally breached the $4,500 milestone in December, the quarter implies that the metal’s prices may have established a new floor.
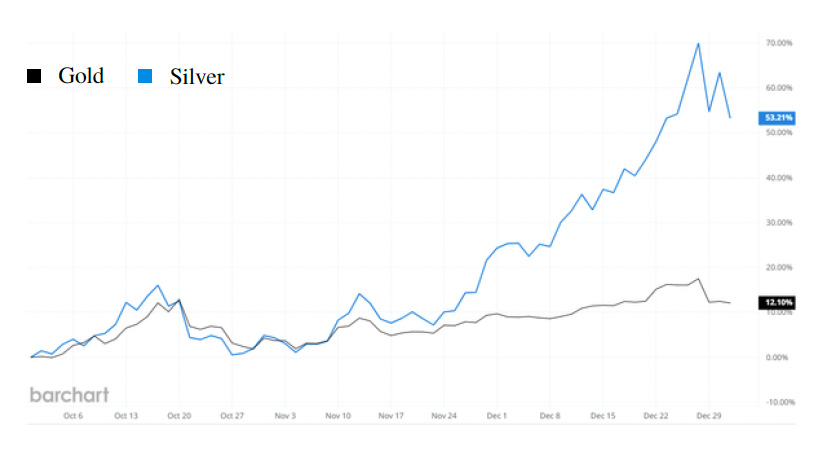
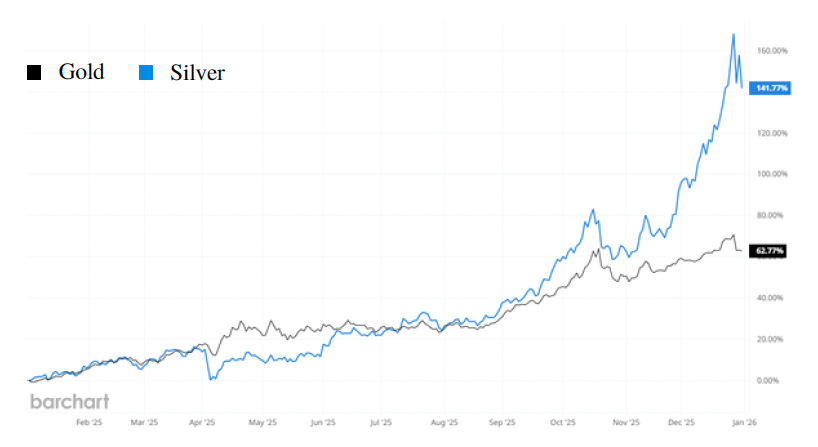
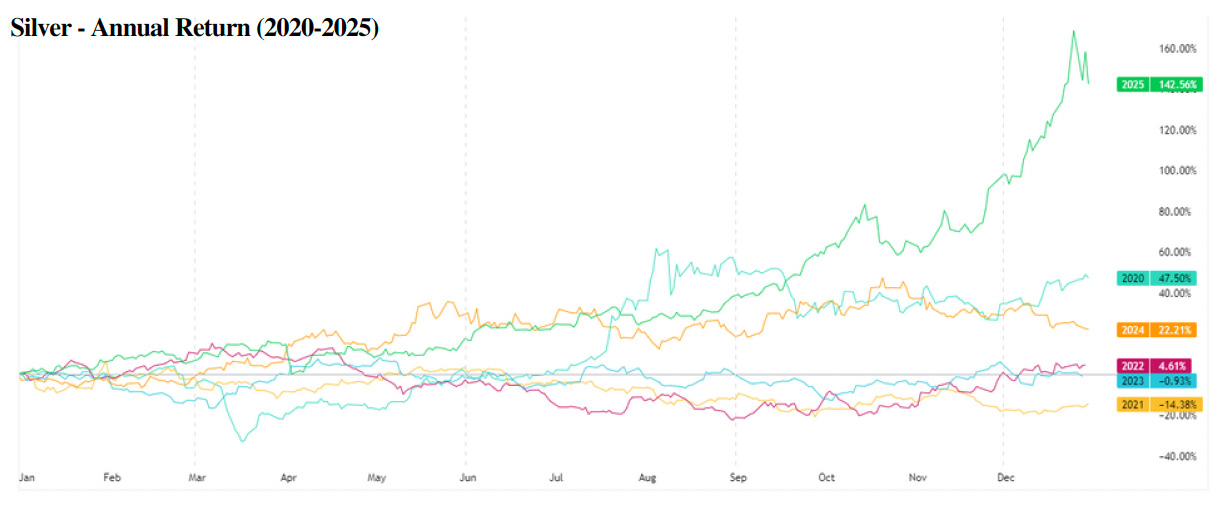
Gold delivered a notable quarterly gain of 12.1%, but was once again overshadowed by Silver which posted a historical 53.21% surge for Q4. This late year acceleration has redefined their annual performance, pushing Gold to a 62% year-to-date return while Silver’s remarkable 141% climb secures its position as the undisputed leader of the 2025 commodities market.
Gold & Silver Performance Q4
Gold & Silver Performance YTD
Gold has surged to new record highs reaching $4,550 per ounce in the last trading days of the year.
Silver’s massive move marked the second highest quarterly gain in the metals history. Surging to a high of $83.75 per ounce on December 29 . This evidently parabolic move is one that has not been seen since 1979, where silver prices doubled within the final three months of the year. Mentioning this performance, the underlying factors contributing to Silver’s push are very different this time, where the 1979 record gain was mainly driven by an artificial shortage and speculative hoarding. In 2025, the metals surge can be attributed to record demand for both industrial and technological applications including AI chip usage, data center infrastructure, as well as clean energy developments relating to Solar based power.
Precious Metals
Building on the historic performance from precious metals in 2025, momentum and demand factors are likely to support the current trend in 2026, especially for silver as a physical shortage remains in the market.
The most recent year marks the fifth consecutive year where the global market has seen a deficit for Silver, this shortfall continues to grow year over year along with accelerating demand needed for industrial applications. With Gold proving to be a true store of value, and its Silver counterpart showing no signs of diminishing demand, prices are technically positioned to remain at elevated levels, with major financial institutions forecasting new highs for both metals.
S&P 500 - SPX
The S&P 500 closed at 6,845 for the year, posting a gain of 2.35% for the final quarter. This move was primarily attributed to better than expected corporate earnings and a stabilizing macroeconomic environment. Rather than seeing year end profit taking, the rally broadened significantly while technology remained a leader. We saw a notable rotation into value and blue-chip stocks at the end of Q4.

Market performance in the fourth quarter remained strong as the largest drawdown seen was less than 6%. Similar to the mentality observed throughout the entirety of 2025, pullbacks were quickly resolved with the market demonstrating its “buy-the-dip” mentality along key moving averages such as the 50DMA and 100DMA seen in late November as well as mid-December.
We expect the outlook for Q1 and 2026 to be fueled by earnings driven momentum as expectations for strong earnings growth would justify sustained bullish movement. Technicals show an index that is not in “overbought” territory in regard to Relative Strength, implying room for upside movement is a likely scenario given the underlying fundamentals. While short-term volatility may arise, we expect these pullbacks to be met with the same recoveries seen throughout 2025. Key levels include price areas along the trendline seen above, in combination with the key moving averages continuously proving to be support levels for the index. Based on fundamental factors and momentum, extension’s include target prices for the S&P at 7,130 followed by 7,360 for the first half of the year.
Dow Jones Industrial Average - DJI
The Dow Jones Industrial Average closed the year at 43,810, rising 3.59% from the last trading day of Q3, closing off a strong final quarter that saw the blue-chip index benefit from a rotation out of pure growth and into high quality value names.

Market volatility for the Dow Jones remained notably suppressed throughout the fourth quarter, with the index successfully navigating year end rebalancing and geopolitical headlines with a maximum drawdown of less than 6%. This stability can be attributed to the 'buy-the-dip' behavior that defined 2025, specifically as the index found recurring support at its 50-day and 100-day moving averages during late-November consolidations similar to the S&P 500.
Similar to the S&P and other indices, we expect the outlook for Q1 and the full 2026 calendar year to be fueled by optimism in fundamentals and earnings, where steady revenue growth and expanding profit margins would justify continued bullish movement. Technical indicators such as the Relative Strength Index shows a neutral to bullish zone where elevated yet non-extreme readings can be observed. The ADL (Advance-Decline Line) measuring market breadth also shows a healthy broad-based rally. Notably, the Dow Jones has been trading within a channel (shown above) since recovering from the lows of April 2025, further supporting a healthy self-correcting uptrend rather than an unsustainable parabolic move. The Dow is likely to continue to trade within this channel into Q1 and Q2, with respective extension levels estimating a target zone of 51,250 for the index for the first half of the year supported by continued rotation into value.
NASDAQ Composite Index - IXIC
Similar to the broader market outlook, we expect the Nasdaq to continue to follow this trend into the new year supported by earnings growth and Artificial Intelligence further maturing in the market. Despite the Nasdaq Composite being the most volatile of the indices, pullbacks for the quarter were resolved similar to other indices. The largest drawdown seen was nearly 9% from October highs, which was preceded by an 8% recovery in the following 20 trading days, and has been continuing to make higher lows within the last quarter of the year.
After a steep correction in April of 2025, the Nasdaq responded with a significant rally for the remainder of the year reaching new all-time highs in October, establishing a strong upward trend. Relative Strength currently sits in a neutral to bullish zone at non-extreme levels along with ADL showing broader participation in the uptrend. The index has been consolidating within the wedge seen above, and a breach above the upper trendline would likely see the Nasdaq retest this high near 24,000. Target levels for IXIC based on extension’s are 24,450 followed by 25,475 for the first half of the year. With earnings season beginning in the second week of January, positive results and optimistic expectations would support higher prices for the Nasdaq.

Market performance in the fourth quarter remained strong as the largest drawdown seen was less than 6%. Similar to the mentality observed throughout the entirety of 2025, pullbacks were quickly resolved with the market demonstrating its “buy-the-dip” mentality along key moving averages such as the 50DMA and 100DMA seen in late November as well as mid-December.
We expect the outlook for Q1 and 2026 to be fueled by earnings driven momentum as expectations for strong earnings growth would justify sustained bullish movement. Technicals show an index that is not in “overbought” territory in regard to Relative Strength, implying room for upside movement is a likely scenario given the underlying fundamentals. While short-term volatility may arise, we expect these pullbacks to be met with the same recoveries seen throughout 2025. Key levels include price areas along the trendline seen above, in combination with the key moving averages continuously proving to be support levels for the index. Based on fundamental factors and momentum, extension’s include target prices for the S&P at 7,130 followed by 7,360 for the first half of the year.
Volatility - VIX
This graph shows annual volatility levels in regard to the VIX (CBOE Volatility Index). Looking back at the VIX movement year-over-year, we can quantify price volatility as well as compare trends from previous years.
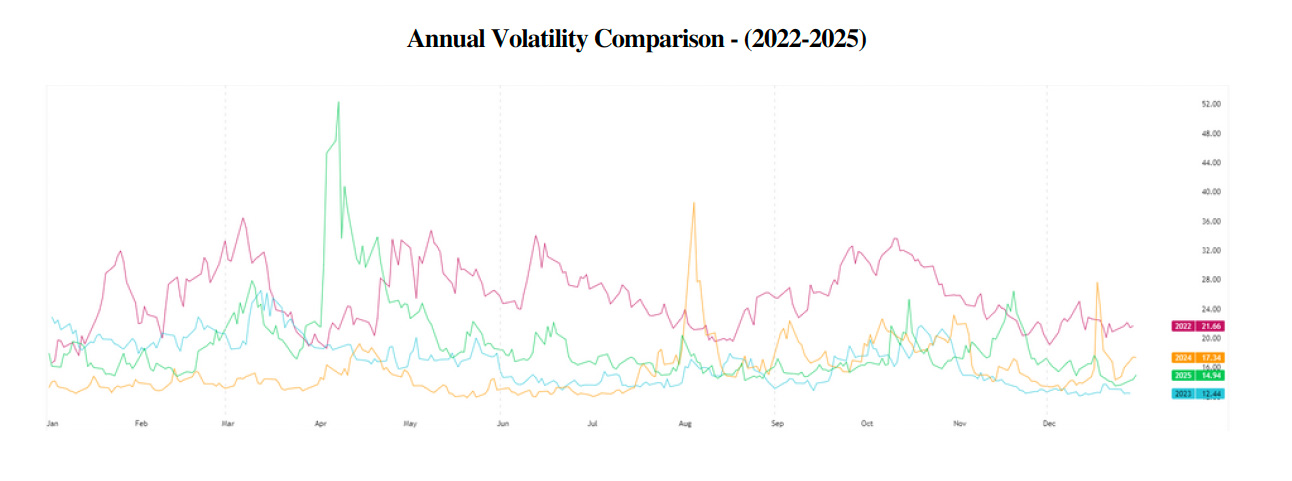
In the beginning months of the year, we can observe relatively stabilized volatility until March of 2025 where elevated volatility and fear in the market was present. This volatility was not the peak for the year, as April presented another more significant spike to 52, the highest VIX value seen in 2025. In fact, this was the largest spike since pandemic levels where the VIX reached 82 in the year 2020. Despite this spike in the early spring, the volatility in these months tapered lower, followed by new highs for the S&P in late December showing remarkable fortitude within the market.
Equities underwent a significant recovery after a 21% decline (for the S&P 500 specifically) between March and April, where a near 31% increase from those April lows occurred into the last trading days of December. In the fall months of October, equities generally see increased volatility as end of the year rebalancing and typical historic seasonality suggests below average performance. Yet, despite this trend of seasonal volatility, there was minimal effect to equities in the fall months where the S&P’s decline, though it lasted throughout a majority of November, was a minimal 6% drawdown from its October 29high. th
While we can see that 2025 as a whole, compared to 2024, had generally higher average volatility, market resilience driven by earnings growth, integration of artificial intelligence, and corporate profits justified a continued bull cycle. Looking forward in 2026, while the geopolitical landscape may present some uncertainties and unforeseen spikes in volatility in U.S. equities, expectations of strong growth and earnings would support these valuations.
Sentiment Statistics
This section aims to gauge market sentiment, providing a way to measure the psychological state of the market, which can assist in identifying potential contrarian opportunities when sentiment becomes extreme. Tracking the percentage of investors who are bullish, neutral, or bearish, offers insight to whether the market is overly optimistic or pessimistic.

In the most recent sentiment survey (conducted on 1/1/26), we can see that sentiment shifted significantly during the final weeks of the quarter. Bullishness currently stands at 42.0%, remaining back near its summer peak of 45.0% established in early July, implying increasing bullish conviction as well as neutral readings (sideline capital) steadily rising in the last quarter of 2025.
In previous sentiment observations, we mentioned that extreme levels of bearish sentiment (over 50%) often coincide with above-average returns for benchmark indexes such as the S&P 500 over the following 3–6 months. In 2025, we can see multiple examples of this correlation continuing to be true. The most extreme pessimism, between February and March, was followed by strong recovery, as well as in early September and mid-November where bearishness spiked towards 50% yet the market responded with strength in its underlying trend. As the current market continues to validate this contrarian indicator, we continuously monitor sentiment as a key factor and guideline in capital positioning.
Market Breadth & Momentum
By comparing market breadth across different timeframes and quarters, we can determine whether an index's price movement is supported by broad participation among its stocks or driven by just a few large-cap names. A review of these metrics provides insight into the underlying trend stability and momentum of the market.
Percentage of Stocks Above Respective Moving Average
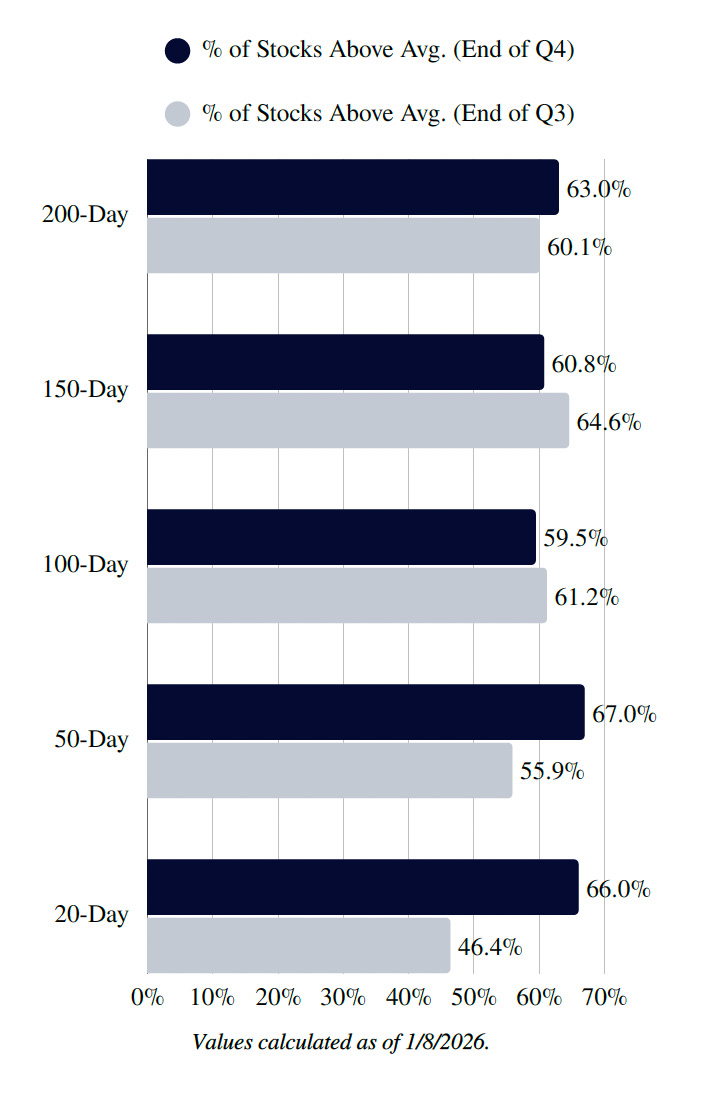
Shown on the left are percentages of stocks that remain above their respective moving averages. In order to further gauge market internals, we can compare the most current reading to data from the prior quarter. A high percentage of stocks trading above their respective moving averages is a positive sign of bullish momentum, and whether this momentum is short or long-term.
This data highlights a significant expansion in market breadth as the year progressed, characterized by increasing short term momentum in Q4. While the intermediate-term participation (100-day and 150- day) saw a slight cooling or rotation, the leap in stocks trading above their 20-day average (climbing from 46.4% to 66.0%) suggests that the primary long-term bull trend remains healthy and that other sectors and equities are participating in the trend.
While the number of stocks trading above their short term moving averages are at elevated levels, they are not extreme levels. A reading of near 80% would show more signs of a market being overextended for short term averages such as the 50-Day and 20-Day.
Risk Analysis - S&P 500
The graph uses three common indicators (SMAs) as the baseline for the market's trend or fair value over different periods. The 50-Day MA which indicates short-term momentum. 100-Day MA (medium-term) which indicates the intermediate trend, and lastly the 200-Day MA (long-term) the most critical line representing the long term trend. The graph above doesn't show the price itself, but represents the difference between the price and the respective moving average, expressed as a percentage to measure extension or divergence from actual price.

This indicator is best used not as a short-term timing tool, but as a measure of structural risk. Despite moving average divergence being at elevated levels, market fundamentals are supporting strong momentum. We can see multiple instances of price divergence indicating increased “risk” without a sudden major directional shift in equity prices. Examples include 2021 through 2022, as well as 2024 through the beginning of 2025, where despite elevated risk or deviation, market momentum can remain for long periods of time due to a stronger underlying trend.
Disclosure
This report has been prepared as a matter of general information regarding market conditions. The information provided here is for general informational purposes only and should not be considered an individualized recommendation or personalized investment advice. The information mentioned here may not be suitable for or in the best interest of everyone. Clients should consider an investment strategy for his or her own situation before making any investment decision and if appropriate, seek professional advice, including legal or tax advice.
l. The views expressed herein accurately reflect personal views. All expressions of opinion are subject to change without notice in reaction to shifting market conditions. All statistics and data contained herein are from sources considered to be reliable. However, its accuracy, completeness, or reliability cannot be guaranteed.
2. This is not an offer to sell securities or the solicitation of an offer to buy securities, nor shall there be any sale of securities in any jurisdiction in which such offer, solicitation or sale would be unlawful prior to registration or qualification under the securities laws of such jurisdiction.
3. Investing involves risk, including loss of principal. Past performance is no guarantee of future results.
4. The information is deemed to be defined as Technical Analysis and is not defined as a Research Report under FINRA Rule 2241.