Why Peter thinks US markets can avoid a short-term correction
October 8, 2025
Wall Street repart en hausse, la tech en éclaireur
October 8, 2025Technical Outlook & Summary Statistics
GIANPAOLO RAFFO - TECHNICAL MARKET STRATEGIST | OCTOBER 3, 2025
Performance Glimpse
The third quarter of 2025 concluded on Tuesday September 30th this report breaks down sector and index performance to better understand momentum, sentiment, and may provide insight to the third quarter of the year. In this overview, major indices, precious metals, momentum, volatility, sector specific performance, and sentiment will be discussed with key statistics and visualizations of market movements to summarize Q3.
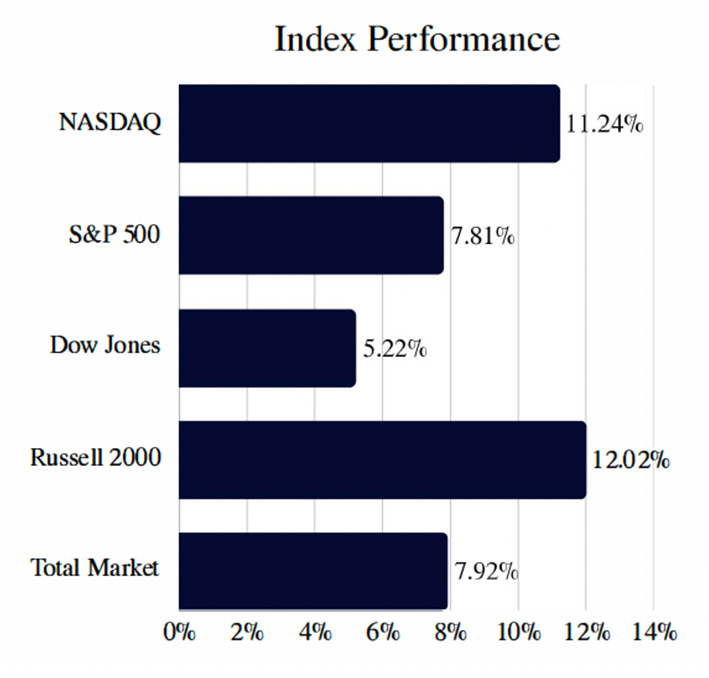
Equities delivered a positive performance during the third quarter, with all major indices posting strong gains led by growth and small-cap stocks. The Russell, representing small-cap companies, was the clear leader of the rally, surging by 12.02%. This was followed closely by the NASDAQ Composite which climbed 11.24%, reflecting the continued outperformance of technology and growth-focused sectors. Meanwhile, large-cap indices also saw solid increases in a broadbased rally, with the S&P 500 advancing by 7.81 °7o and the Dow Jones Industrial Average rising by 5 .22%. Overall, the quarter showed a clear rotation into smallcaps, with the Russell 2000 and NASDAQ significantly outpacing the Dow. .57%) and Russell (+8.11%) also both had above-average performance for the quarter. The Dow Jones was up 4.98% for Q2. All major indices, except for the Russell, were able to reclaim losses seen in the first quarter of the year, representing a resilient market. Important to note that from April lows, where markets continued to fall into the start of Q2, all indices experienced robust recovery, with performance from those lows all above 20%. The Nasdaq and S&P also were able to make new all-time highs within the last week of Q2, a key technical level in regard to market sentiment.
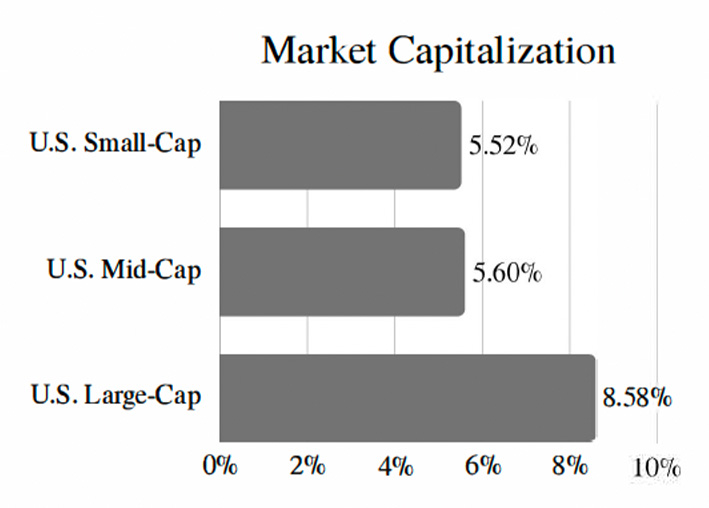
Looking at performance in terms of market capitalization, we see that all market capitalization categories posted positive inflows for Q3. The expansion of market breadth, where we see a wide variety of stocks participating in a continued rally, emphasize healthy rotation combined with further focus on the leading sectors for 2025, which are largecap Technology and Communications.
Q3 Sector Performance
In this section, we'll break down the market's third-quarter performance by sector. The third quarter delivered broadbased gains, with a majority of S&P sectors finishing in positive territory. Growth-oriented sectors like Information Technology and Communication Services continued to lead the market higher.
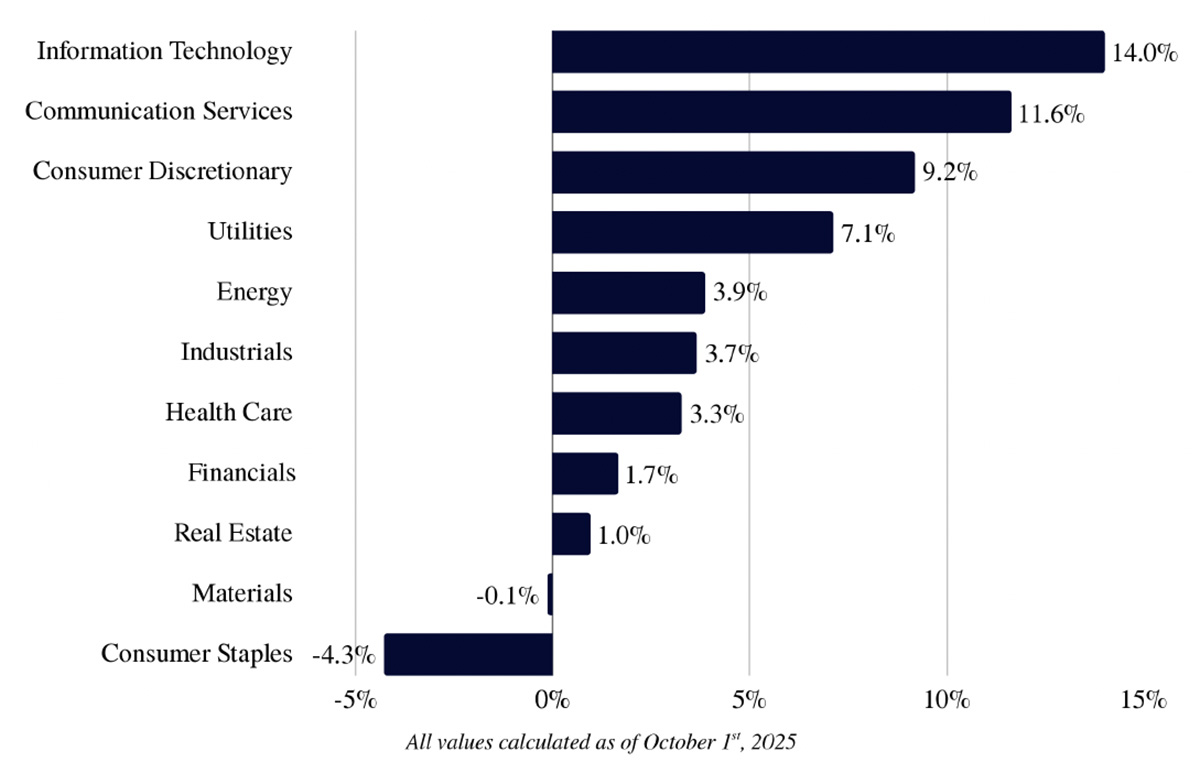
The graph above includes S&P Indexes by Sector and their quarterly performance for Q3 2025 ...
• The leading sector for the quarter was Information Technology, up 14% for Q3. This sector was also leading in performance for Q2. Other sectors with noteworthy performance include Communication Services, Consumer Discretionary, and Utilities respectively.
• Additional sectors posting positive returns, though more modest, include Energy, Industrials, Health Care, Financials, and Real Estate.
• Lagging sectors included Materials with minimal percentage decline of less than 1 %, and Consumer Staples as the laggard for Q3 with -4.3% performance. This significant underperformance suggests investors were actively rotating out of defensive sectors into more growth-based equities.
Sector Performance (Q2 Comparison)
This section provides a comparative look at sector performance between the second and third quarters. While the market's upward trend continued, these shifts indicate a clear rotation in sector leadership between the quarters.
Information Technology cooled from a 20.9% gain in Q2 to 14.00Jo in Q3, it remained the top performer. The most dramatic reversal occurred in Consumer Staples, which fell from a 1.4% gain to a -4.3% loss. Other key turnarounds include the Health Care sector, which rebounded from a -4.2% loss to a 3.3% gain, and the Energy sector's recovery from -9.SOJo to +3.9%. The Industrials sector saw its momentum slow considerably, falling from an 11.9% gain to 3.7%

Precious Metals
Precious metals delivered a standout performance in the third quarter of 2025, driven by a combination of strong safehaven demand, favorable central bank policies linked to interest rates, and strong industrial demand.
Gold posted an impressive quarterly gain of 16%, while Silver significantly outpaced the yellow metal, surging 29% for the quarter. This exceptional momentum has solidified their year-to-date returns, with Gold now up 48.5% and Silver demonstrating remarkable strength with a 64% year-to-date increase, positioning them as some of the best-performing assets of 2025.
Gold & Silver Performance Q3

Gold has surged to new record highs, surpassing $3,860 per ounce as of late September.
Silver has also seen a significant rally, surpassing $44 per ounce, driven by rapidly increasing industrial demand. The silver market has been facing a persistent supply deficit for the third consecutive year also contributing to increased demand.
Gold & Silver Performance YTD

Persistent inflation, which remained above the Fed's target rate, combined with slowing economic growth raised fears of stagflation. Domestic policy risk, including tensions around trade tariffs and the possibility of a U.S. government shutdown support higher prices for both metals, this trend is likely to continue as uncertainty remains in the market.
Market Breadth & Momentum
By comparing market breadth across different timeframes and quarters, we can determine whether an index's price movement is supported by broad participation among its stocks or driven by just a few large-cap names. A review of these metrics provides insight into the underlying trend stability and momentum of the market. avorable central bank policies linked to interest rates, and strong industrial demand. Gold posted an impressive quarterly gain of 16%, while Silver significantly outpaced the yellow metal, surging 29% for the quarter. This exceptional momentum has solidified their year-to-date returns, with Gold now up 48.5% and Silver demonstrating remarkable strength with a 64% year-to-date increase, positioning them as some of the best-performing assets of 2025.
Percentage of Stocks Above Respective Moving Average
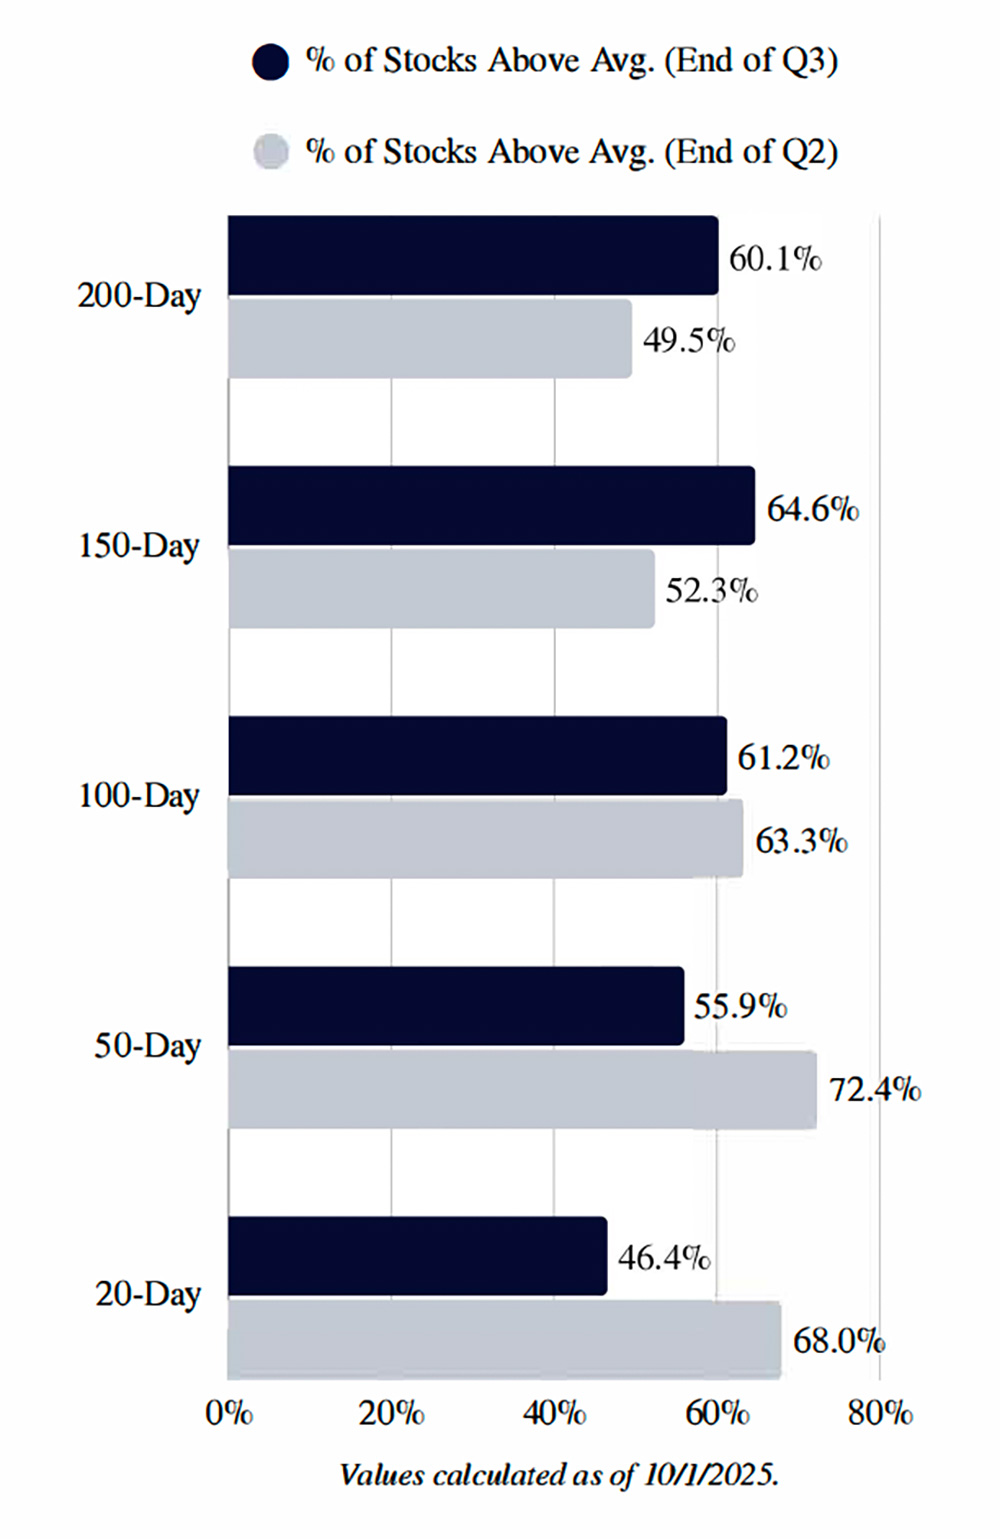
Shown on the left are percentages of stocks that remain above their respective moving averages. In order to further gauge market internals, we can compare the most current reading to data from the prior quarter. A high percentage of stocks trading above their respective moving averages is a positive sign of bullish momentum, and whether this momentum is short or long-term.
Momentum in the long-term averages (200-Day and 150-Day) jumped from nearly 50% to well over 60%. This shift indicates that the bullish trend became much more sustainable and widespread across stocks over the quarter.
For short-term moving averages, momentum was lower in the final weeks of Q3 compared to the end of Q2. Despite this, the long-term health of the market improved significantly, at the expense of short-term momentum.
S&P 500 - SPX
The S&P 500 closed at 6,688 for the third quarter of the year, posting a gain of 7.810/o. The rally led the index to new all-time highs, defying the historically challenging nature of the third quarter in terms of performance. The momentum was driven by key factors including resilient economic data, strong corporate earnings, and continued enthusiasm in technology companies. The exceptional performance, one of the best third quarters in the past 20 years, showed broad market strength, as the rally's momentum extended beyond large-caps to include significant gains in small-cap sectors.

The graph above includes S&P Indexes by Sector and their quarterly performance for Q3 2025 ...
Market performance and volatility in the third quarter was relatively stable, where the largest pullback for the S&P was less than 40/o in early August, which was quickly resolved as the core bullish trend remained intact. Prices remained above both the 50-Day and 200-Day moving averages indicating bullish price momentum. The pullback in equities that occurred in February/March (shown above) shifted public sentiment, creating a more appealing entry point for investors which has allowed the long-term rally to continue throughout the year and into the third quarter.
We expect the outlook for Q4 to be cautiously optimistic as the market weighs upcoming earnings, expected rate cuts, and continued political uncertainty. Despite market internals showing the S&P approaching overbought levels, the bullish trend is likely to continue in the long-term as Q4 is historically the strongest quarter of the year for equities. Uncertainties in the market may produce short-term pullbacks, but we expect the underlying trend to remain. Key support levels are the 6,500 level, as well as 6,125 along the 50-DMA, and lastly near 5,500 along the trendline. The following target level for the index is approximately 7,100, calculated through a trend-based extension.
NASDAQ Composite Index - IXIC
The Nasdaq closed at 22,660 for the third quarter of the year, posting a gain of 11.24%. The Nasdaq closed at all-time highs, driven primarily by the technology sector. The Nasdaq's performance led in comparison to its peers, outpacing both the broader S&P 500 and the blue-chip Dow Jones Industrial Average. Breaching through the previous all-time high of 20,200 in early July, provided a key psychological and technical confirmation of the market's resilience.
The graph above includes S&P Indexes by Sector and their quarterly performance for Q3 2025 ...
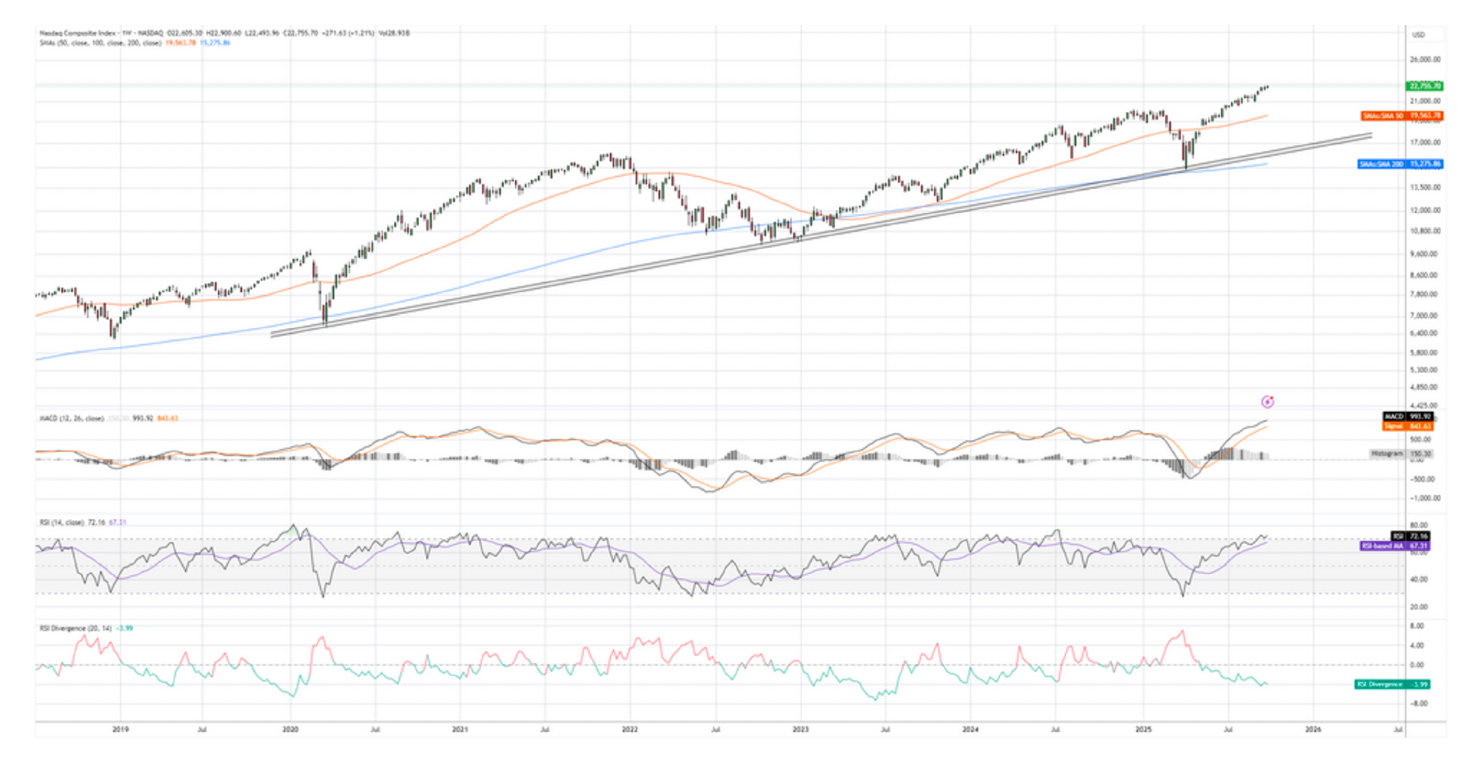
Similar to the broader market outlook, we expect the Nasdaq to continue follow the strong trend as well as weigh upcoming corporate earnings. Market internals show that underlying relative strength remains healthy and although at elevated levels, they are non-extreme, suggesting there is room for further upward movement as equities can remain in "overbought" conditions for prolonged periods.
We attribute the Nasdaq's persistent strength with the market focusing on Technology and Communication sectors, in combination with enthusiasm for Artificial Intelligence related equities. Monetary policy regarding rate cuts, as well as investor sentiment, induced positive outlooks for high-growth, high valuation technology stocks.
From a technical perspective, key areas for the index beginning with support are near the 50-Day moving average of 19,560, next the 20,200 area which is the previous all-time high level, and 21,800, a key retracement level. A trendbased extension for the Nasdaq sees a target of approximately 24,450, barring any significant negative catalysts.
Sentiment Statistics
This section aims to gauge market sentiment, providing a way to measure the psychological state of the market, which can assist in identifying potential contrarian opportunities when sentiment becomes extreme. Tracking the percentage of investors who are bullish, neutral, or bearish, offers insight to whether the market is overly optimistic or pessimistic .

The graph above includes S&P Indexes by Sector and their quarterly performance for Q3 2025 ...
In the most recent sentiment survey ( conducted on 10/1/25) we can see that sentiment shifted dramatically in the final weeks of the quarter. Bullishness remains back near its summer peak, and the difference between bullish and bearish outlooks are the narrowest it has been in over two months.
In the previous sentiment analysis, we mentioned that extreme levels of bearish sentiment ( over SOOJo) often coincide with above-average returns (for the following 3-6 months) for benchmark indexes such as the S&P. An example of this correlation is observed from August/September sentiment readings. The week of September 10th marked a period of high pessimism not seen since May, with bearishness at 49.SOJo and bullishness falling to 28.00Jo. Since then, equities have remained resilient, and all indices continue to make all-time highs. In the present, sentiment remains at nonextreme levels with a slight edge in bullishness, supporting the long-term trend for equities.
Disclosure
This report has been prepared as a matter of general information regarding market conditions. The information provided here is for general informational purposes only and should not be considered an individualized recommendation or personalized investment advice. The information mentioned here may not be suitable for or in the best interest of everyone. Clients should consider an investment strategy for his or her own situation before making any investment decision and if appropriate, seek professional advice, including legal or tax advice.
-
The views expressed herein accurately reflect personal views. All expressions of opinion are subject to change without notice in reaction to shifting market conditions. All statistics and data contained herein are from sources considered to be reliable. However, its accuracy, completeness, or reliability cannot be guaranteed.
-
This is not an offer to sell securities or the solicitation of an offer to buy securities, nor shall there be any sale of securities in any jurisdiction in which such offer, solicitation or sale would be unlawful prior to registration or qualification under the securities laws of such jurisdiction.
-
Investing involves risk, including loss of principal. Past performance is no guarantee of future results.
-
The information is deemed to be defined as Technical Analysis and is not defined as a Research Report under FINRA Rule 2241.
45 Broadway, 19th Floor New York, NY 1006 | Tel 212 293 0123 | 877 772 7818 | Fax 212 785 4565
www.spartancapital.com | Member of Finra | SIPC | MSRB Registered