Rubio to Attend ASEAN, East Asia Summit in Malaysia | NewsX World
July 8, 2025
Linea Mercati Interview 7/9/25
July 9, 2025Technical Outlook & Summary Statistics
GIANPAOLO RAFFO - TECHNICAL MARKET STRATE GIST | JULY 3, 2025
Performance Glimpse
As the second half of the fiscal year concluded on Monday, June 30th, this report breaks down sector and index performance to better understand momentum, sentiment, and may provide insight to the third quarter of the year. In this overview, major indices, precious metals, sentiment, momentum, volatility and sector specific performance will be discussed with key statistics and visualizations of market movements to summarize Q2 .
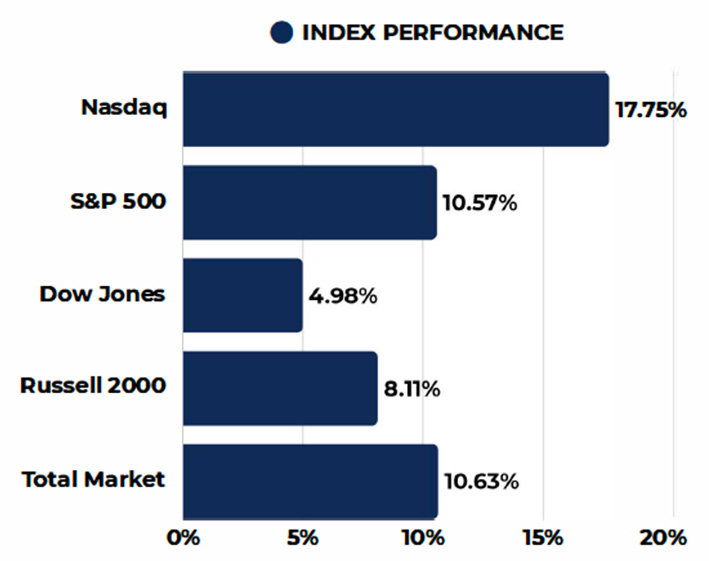
For the second quarter of the year, all major indices posted noteworthy gains. The Nasdaq led all major indices, closing nearly 18% higher from the last day of Ql. The S&P (+10.57%) and Russell (+8.11%) also both had above-average performance for the quarter. The Dow Jones was up 4.98% for Q2. All major indices, except for the Russell, were able to reclaim losses seen in the first quarter of the year, representing a resilient market. Important to note that from April lows, where markets continued to fall into the start of Q2, all indices experienced robust recovery, with performance from those lows all above 20%. The Nasdaq and S&P also were able to make new all-time highs within the last week of Q2, a key technical level in regard to market sentiment.
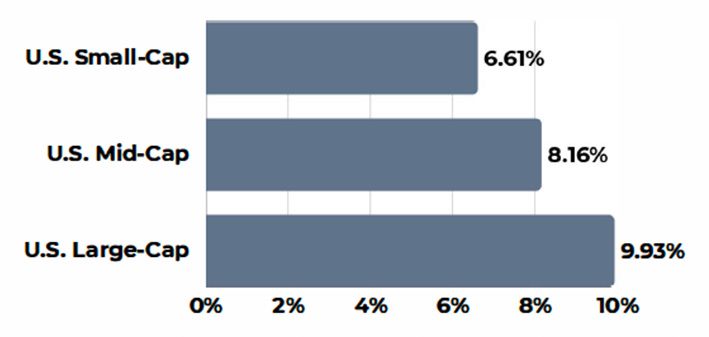
Looking at performance in terms of market capitalization, we see that all all market cap categories posted positive inflows for Q2. In comparison to the first quarter where all three categories were in negative territory, a significant rebound for all market caps, specifically small and large-caps, was observed in Q2.
Q1 Sector Performance

The chart above includes S&P Indexes by Sector and their quarterly performance for Q2 2025 ...
• Leading sectors for the quarter include Information Technology as the leading sector, up 20.09% for Q2, other noteworthy sectors include Communications, Industrials, and Consumer Discretionary, all with positive quarterly performance between 10% and 15%.
• Additional sectors posting positive returns, though more modest, include Financials, Materials, Utilities, and Consumer Staples.
• Lagging sectors included Real Estate, which remained nearly flat with slight losses, followed by Health Care as well as Energy that had the worst performance for the quarter with the sector down 9.5% from Ql's close.
S&P 5OO - SPX
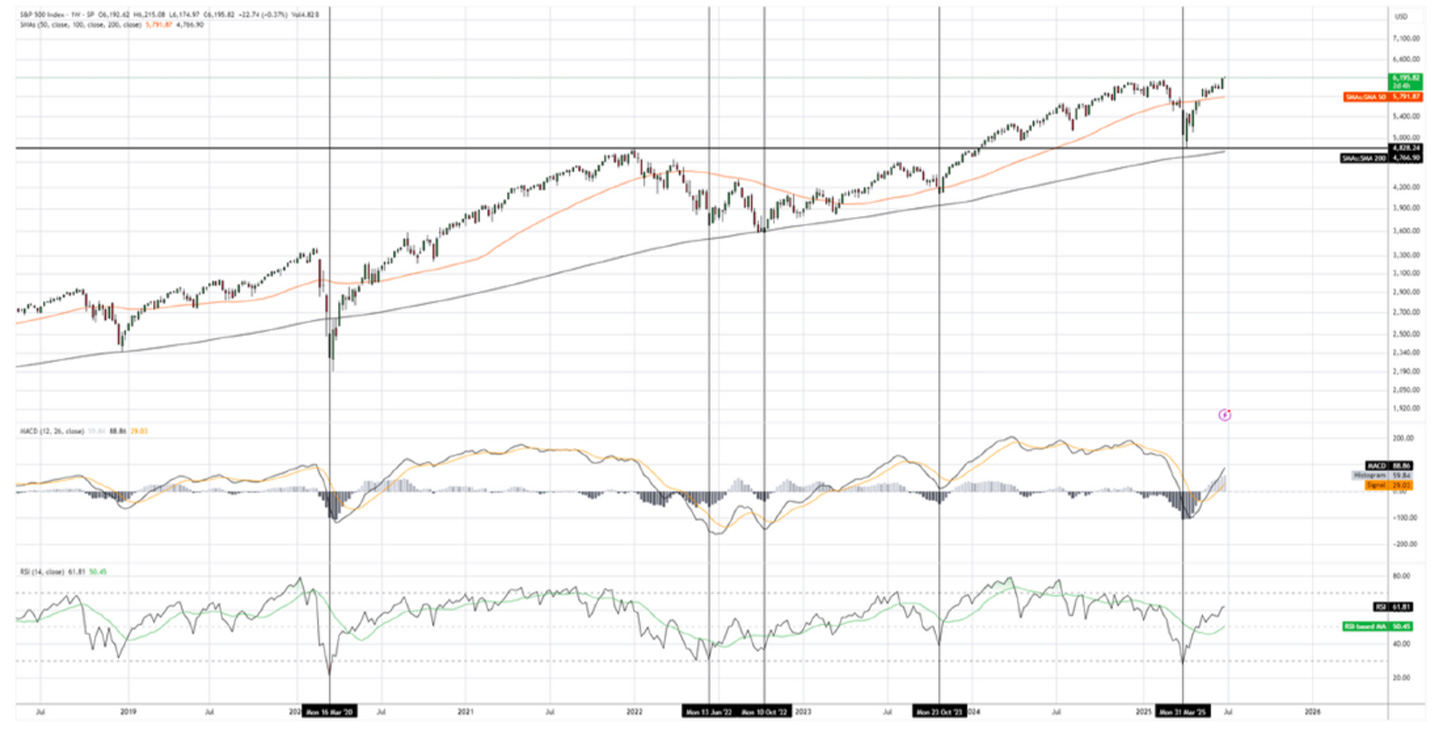
The S&P 500 closed at 6,204 for the second quarter of the year, posting a gain ofl0.57%. Following market weakness at the end of the first quarter and slightly into the Q2, where the index was down approximately 21% from February's highs, a technical rebound supported by fundamental factors allowed the index to recoup losses. The S&P found support from April lows at the key 200-Day moving average, as well as retesting the previous index high from January 2022 at 4,825. The index currently is trading at all-time highs with technical indicators such as relative strength and MACD at non-extreme levels, a positive sign for continued bullishness.
Key Technicals
• Support levels for the S&P are respectively 6,100 followed by 5,850, as well as 5,750 on the lower end.
• Resistance levels calculated from trend-based extensions include 6,470, 6,560, followed by 6,790.
• The technical outlook for the S&P, in regard to relative strength, remains at favorable levels where the index is not in overbought territory on a weekly chart. MACD also shows positive momentum, with values not reaching extreme levels .. This supports room for continued positive performance on a medium to long-term technical basis.
Dow Jones Industrial Average - DJi
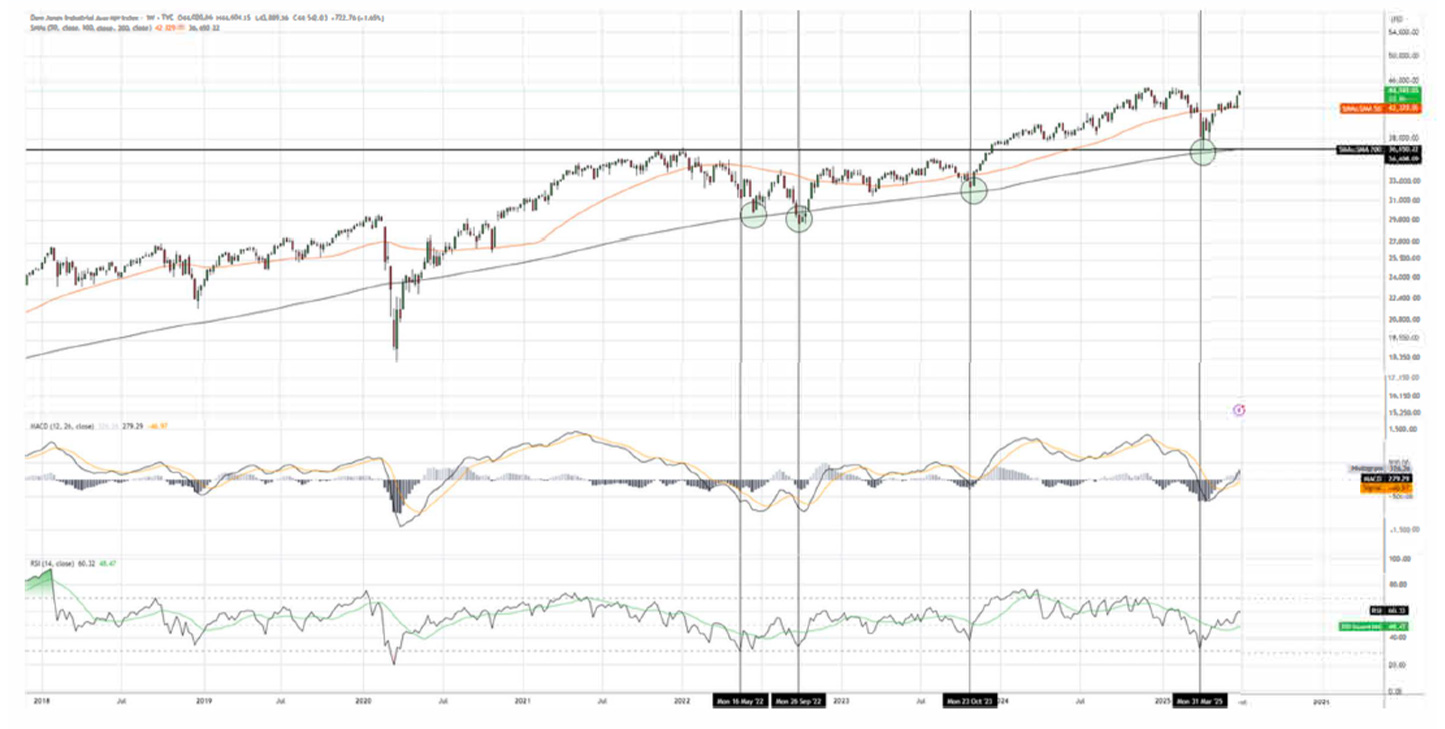
The Dow Jones Industrial Average closed at 44,094.77 for the second quarter of the year, posting a gain of 4.98%. Similar to the S&P 500 and other indices, weakness throughout Ql was followed by a sharp recovery. The Dow Jones had solid performance for Q2, but important to mention that from April lows, the index is up nearly 20%. The index has yet to breach above its all-time high just over 45,000, despite this, the index appears to be following suit, similar to the S&P and Nasdaq.
Key Technicals
• Support levels for the Dow are 43,975, followed by approximately 43,000, and 42,325 along the SO-Day Moving Average.
• Resistance levels for the index are 44,600, followed by the all-time high level of approximately 45,000.
• The technical indicators for DJI are also at desirable levels, where relative strength in trending upwards from the oversold levels in April, combined with MACD indicating positive momentum and room for expansion.
• The weekly oversold reading seen in April has shown that oversold levels for the Dow on a weekly chart have served as good indications of nearing bottoms during equity downturns.
NASDAQ Composite lndex - IXIC
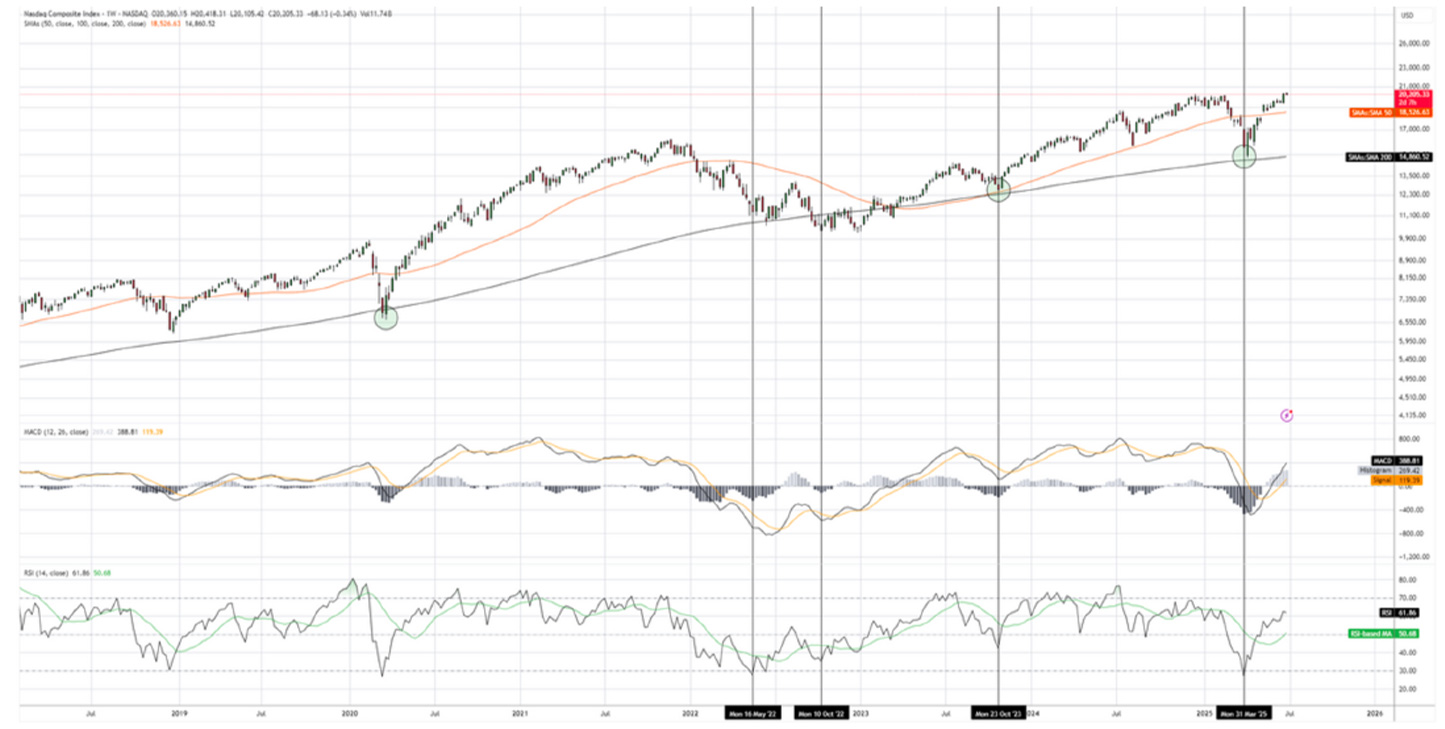
The Nasdaq closed at 20,369.73 for the second quarter of the year, posting a gain of 17.75%. The Nasdaq closed at all-time highs, surpassing previous all-time highs seen earlier in February of this year. Similar to the other indexes, the Nasdaq recovered impressively from April lows, up approximately 36% from those levels demonstrating the market's resilience. The index found support at the 200DMA on the weekly chart, ensuing a V-shaped recovery from oversold levels. We see this trend continuing into Q3. The technical indicators also remain sound, with upward trending RSI and momentum.
Key Technicals
• Support zones for the Nasdaq are approximately 20,100 near the previous highs, followed by 19,350, 18,900, and 18,500 along the SO-Day Moving Average.
• The following resistance level calculated through a trend-based extension would likely be near 22,000.
• Relative strength and MACD remain at non-extreme levels, trending upwards. As of June 30th, we observed a goldencross on the daily timeframe where the SO-Day Moving Average crosses above the 200DMA. This suggests that shortterm momentum is increasing and may lead to a sustained period of rising prices.
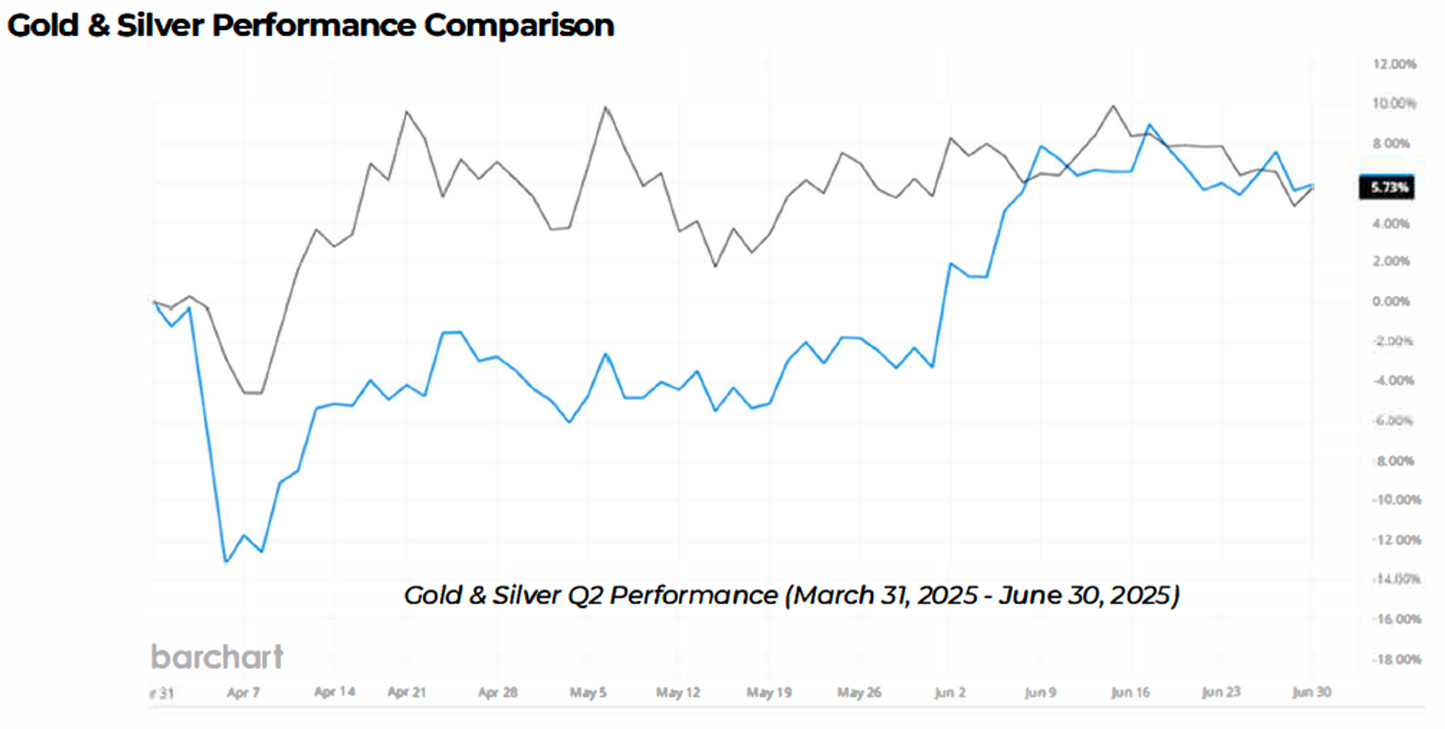
Precious Metals
Other than equity index performance, precious metals, specifically Gold and Silver had positive performance in Q2.
Other than equity index performance, precious metals, specifically Gold and Silver had noteworthy performance in Q1.
• Gold continues to show its strength, currently trading slightly below its alltime high, as well as reaching as high as $3,500/oz in the beginning of Q2.
• Despite gold prices surging in the first quarter of the year, up nearly 20% in Ql, the trend shows continuous demand at these levels and support above the $3,000/oz price level. A second positive quarter for the metal.
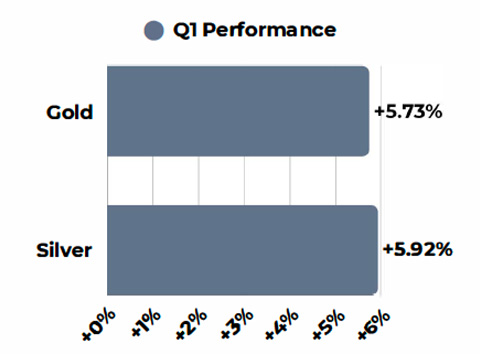
• Silver's performance was on par with its gold counterpart, both posting gains just under 6%.
• Silver's correlation with gold has resulted in prices reaching their highest levels since 2012. We expect to see prices of both metals continue their bullish trend.
Sentiment Statistics
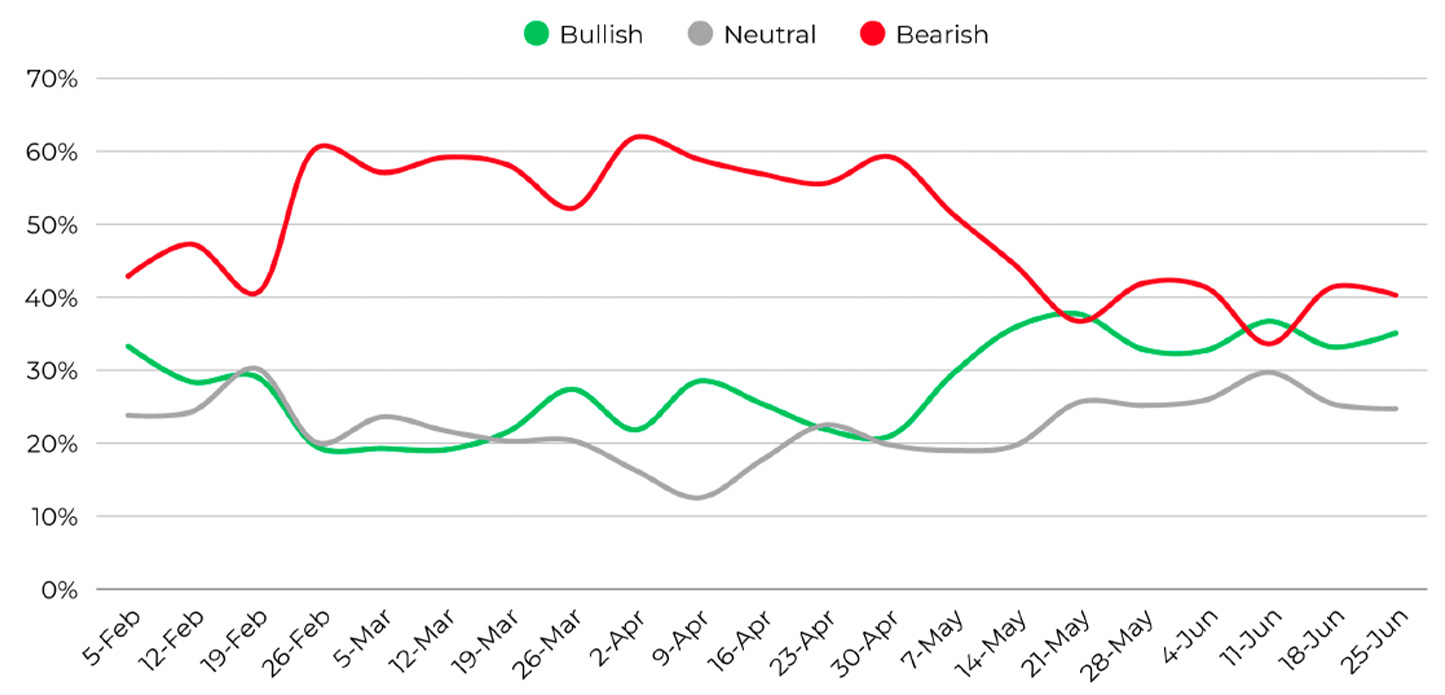
The chart above is a collection of weekly sentiment readings from the American Association of Individual Investors (MIi), gauging investors outlook on equity markets for the following 6 months. www.aaii.com/sentimentsurvey
Looking at other key metrics that measure sentiment and momentum, the most recent sentiment survey (conducted on
6/25/25} we can see a slight bearish edge in terms of sentiment, but significantly down from bearish readings seen at the end of Ql and beginning of Q2. Bullish sentiment continues to show a gradual increase week over week since April, and we expect this trend to continue into the third quarter of the year.
In the previous Ql sentiment analysis, we mentioned that extreme levels of bearish sentiment (over 50%} often coincide with above-average returns (for the following 3-6 months) for benchmark indexes such as the S&P. From the lows in April where a majority of investors remained bearish, we observed the S&P rally approximately 28% from the 4,800 level. In the present, the absence of extreme sentiment readings in any category may indicate that a continued move upwards for markets is sustainable.
Market Momentum Statistics

Included on the left are percentages of stocks that remain above their respective moving averages. In order to further gauge market internals, we can compare the most current reading to data from the prior month. A high percentage of stocks trading above their respective moving averages is a positive sign of bullish momentum.
• Momentum in the long-term averages have shifted significantly in comparison to a month ago, where we see an increase in equities trading above their 15 0-Day and 200- Day Moving Averages.
• At the end of Ql, only 36.3% of equities were trading above their 200-Day Moving Average, whereas the percentage is now 49.5%, a positive long-term sign for equities.
• Another key average for shorter-term momentum is the S0DMA reading 72.4%, compared to the Ql reading of 27%, showing short term momentum is also strong in equities.
Disclosure
This report has been prepared as a matter of general information regarding market conditions. The information provided here is for general informational purposes only and should not be considered an individualized recommendation or personalized investment advice. The information mentioned here may not be suitable for or in the best interest of everyone. Clients should consider an investment strategy for his or her own situation before making any investment decision and if appropriate, seek professional advice, including legal or tax advice.
-
The views expressed herein accurately reflect personal views. All expressions of opinion are subject to change without notice in reaction to shifting market conditions. All statistics and data contained herein are from sources considered to be reliable. However, its accuracy, completeness, or reliability cannot be guaranteed.
-
This is not an offer to sell securities or the solicitation of an offer to buy securities, nor shall there be any sale of securities in any jurisdiction in which such offer, solicitation or sale would be unlawful prior to registration or qualification under the securities laws of such jurisdiction.
-
Investing involves risk, including loss of principal. Past performance is no guarantee of future results.
-
The information is deemed to be defined as Technical Analysis and is not defined as a Research Report under FINRA Rule 2241.
45 Broadway, 19th Floor New York, NY 1006 | Tel 212 293 0123 | 877 772 7818 | Fax 212 785 4565
www.spartancapital.com | Member of Finra | SIPC | MSRB Registered