Linea Mercati Interview 6/28/24
July 1, 2024Wall Street concludes down but signs a strong first half of 2024
July 2, 2024TECHNICAL OUTLOOK & STATISTICS
GIANPAOLO RAFFO | JUNE 28, 2024
PERFORMANCE GLIMPSE
As the second quarter concluded on the Tuesday, June 25th, breaking down sector and index performance to better understand momentum and sentiment, may provide insight to the third quarter of2024. In this report, major indices, sentiment, momentum, volatility and sector specific performance will be discussed with key statistics and visualizations of market movement to summarize Q2 of 2024.

In terms of major indices, the Nasdaq led {+8.06%) in terms of percentage gains, followed by the S&P with posted gains
(+4.30%) for the quarter. Other indices lagged for the second quarter with the Dow slightly lower (-7.75%) from the close on April 1st, as well as the Russel being the worst performer of the group (-3.82%). Important to note that equity markets declined at the beginning of the quarter throughout April and have since recovered. In terms of market capitalization, large caps attributed to a majority of the positive movement in equities, posting quarterly gains of 6.30%, mid-caps closed the quarter lower (-2.94%), with small caps being the worst performer down -4.37%.
S&P SECTOR OVERVIEW

The chart above includes S&P Indexes by Sector and their quarterly performance for Q2 2024 ...
- Leading sectors for the quarter include Information Technology as the leading sector followed by Communications, Utilities, and Consumer Staples.
- Other sectors with positive performance for the quarter but lower than its leaders, include Consumer Discretionary, and Health Care, both posting gains of below 7.00%, but up from the close of Ql.
- Lagging sectors for the second quarter include Financials, Real Estate, Industrials, Energy, and lastly Materials as the worst performer of the group.
S&P 500 INDEX - SPX

The S&P 500 closed at 5,477 for the second quarter of the year, posting a gain of +4.30% for the quarter, the second-best performing index behind the Nasdaq. It is important to note that the index began Q2 rather sluggishly in April with a brief 5.65% decline. Despite this, from this April's lows, the S&P was up approximately 70.75%. With the index sitting near all-time highs, a break above this psychological level would likely imply a continuation of the rally in equities as earnings season approaches.
Key: Technicals
- Support levels for the S&P are respectively 5,375, followed by the key Fibonacci extension level of 5,260.
- MACO and RSI are diverging from price action as the market continues to make new highs while key indicators do not, if the indicators follow through to make new highs, this would be a positive sign for equities as the internals solidify price action.
- In combination with the above, the Advance/Decline indicator is also hinting at a decline in breadth, where the indicator is moving lower while the S&P moves higher. Suggesting there are few large-cap leaders attributing to the index's rise.
DOW JONES INDUSTRIAL AVERAGE - DJI
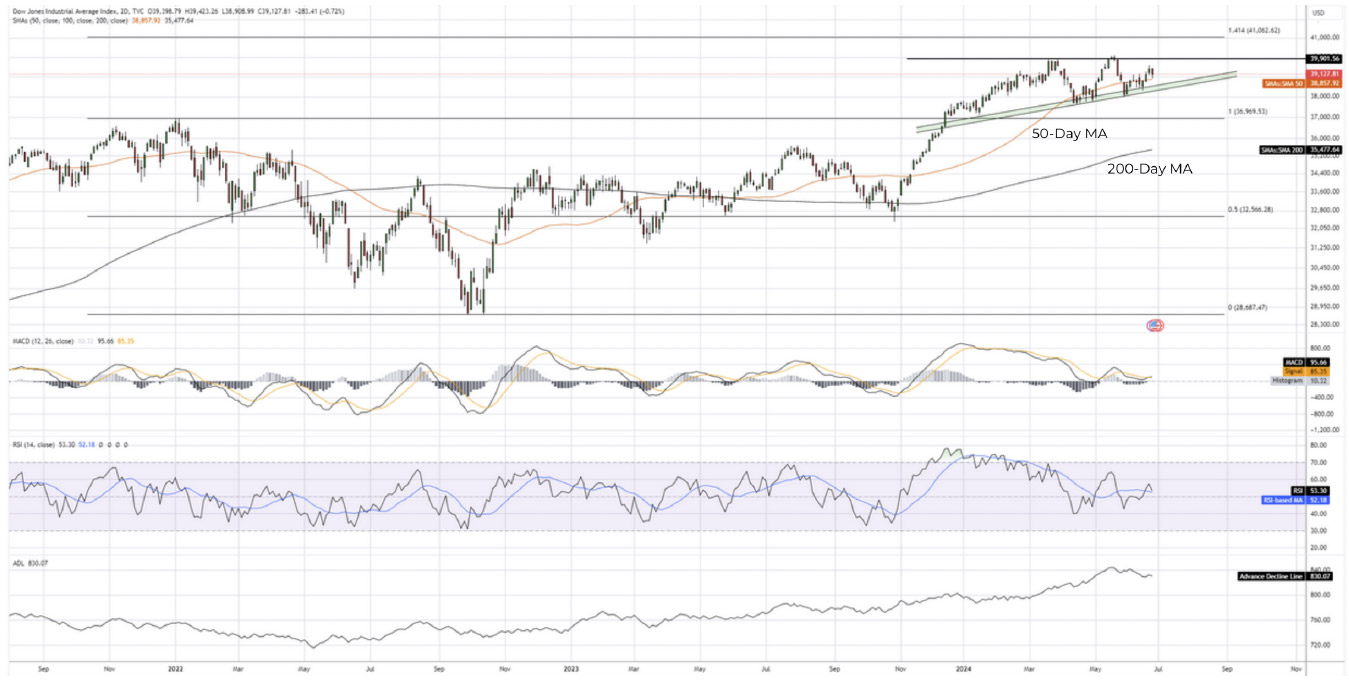
The Dow Jones finished the second quarter slightly lower with negative performance of -7.75%, but up from the April lows about 5%. Since breaching the previous all-time high in December of 2023, the Dow has shown a steady upward trend above 37,000 but has met resistance twice just below the 40,0000 level. DJI continues to make higher lows within this trading range, a positive sign as the next technical catalyst would be a successful breach above the 39,900 level.
Key Technicals
- Support levels for the Dow are respectively 38,500 along the trend line, as well as the SOD MA at a value of 38,850. • MACD and RSI are not signaling any weakening of market breadth, but remain in neutral territory.
- In the short term, seeing the MACD indicator for the Dow Jones crossover positively would likely suggest another attempt at retesting the 39,900 level to escape the current trading range, where 47,000 would be the next target.
- DJI has respected the upward sloping trend line on multiple occasions since making a new all-time high in December 2023.
NASDAQ - IXIC
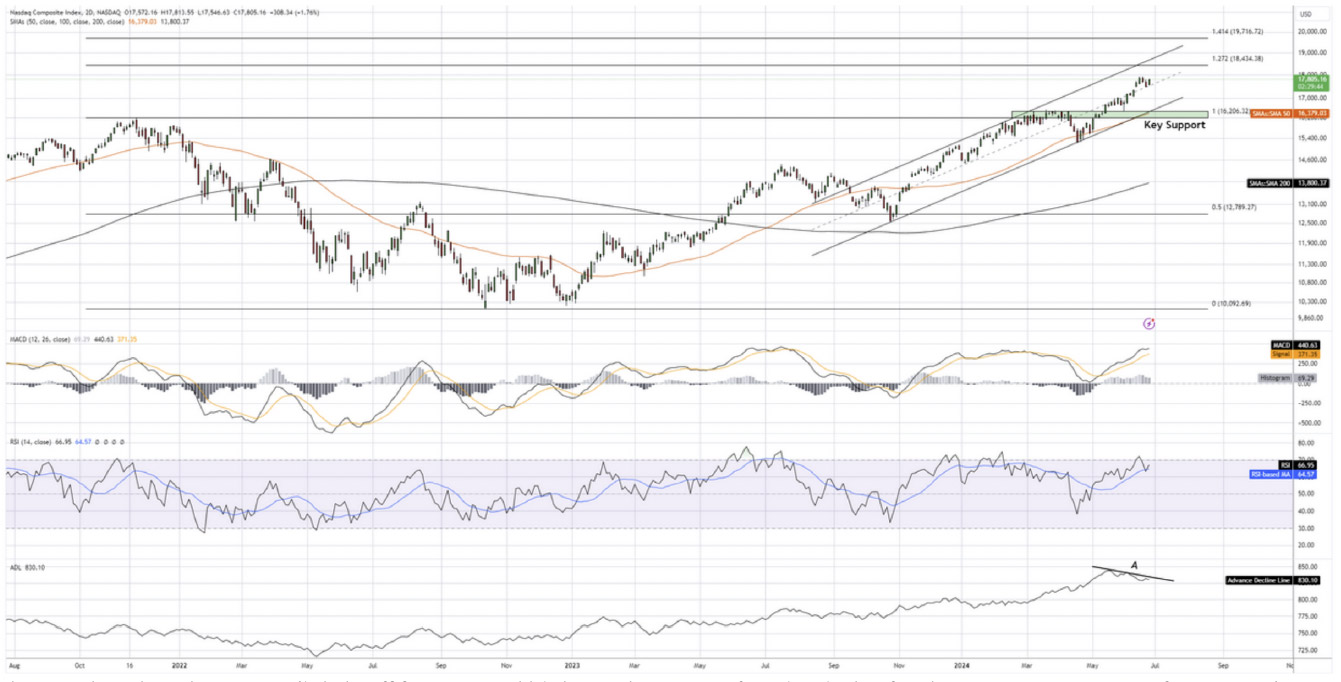
The Nasdaq closed at 77,777 slightly off from record highs as the top performing index for the quarter, up +8.06% from Ql's close. Similar to its counterparts, it recovered from the poor start to the second quarter, up approximately 77% from mid-April lows. The Nasdaq's gains can be attributed to sector specific performance in large cap Information Technology and Communications. Technical strength within indicators and a healthy upward channel seen above are factors that confirm a strong trend.
Key Technicals
-
Support zones for the Nasdaq are the 77,350 level where a runaway gap occurs, followed by the 76,250 area as key support.
-
MACD and RSI for the index are showing positive signs of agreement in the move upwards, as the indicators are making new highs as the market does. This is also a positive indication of the other indexes following a similar path without divergence.
-
As equities continue to show strength, it is vital to observe key indicators such as RSI and MACD coincide with price action, providing evidence of strong market internals in a trending market.
RUSSEL 2000 - RUT
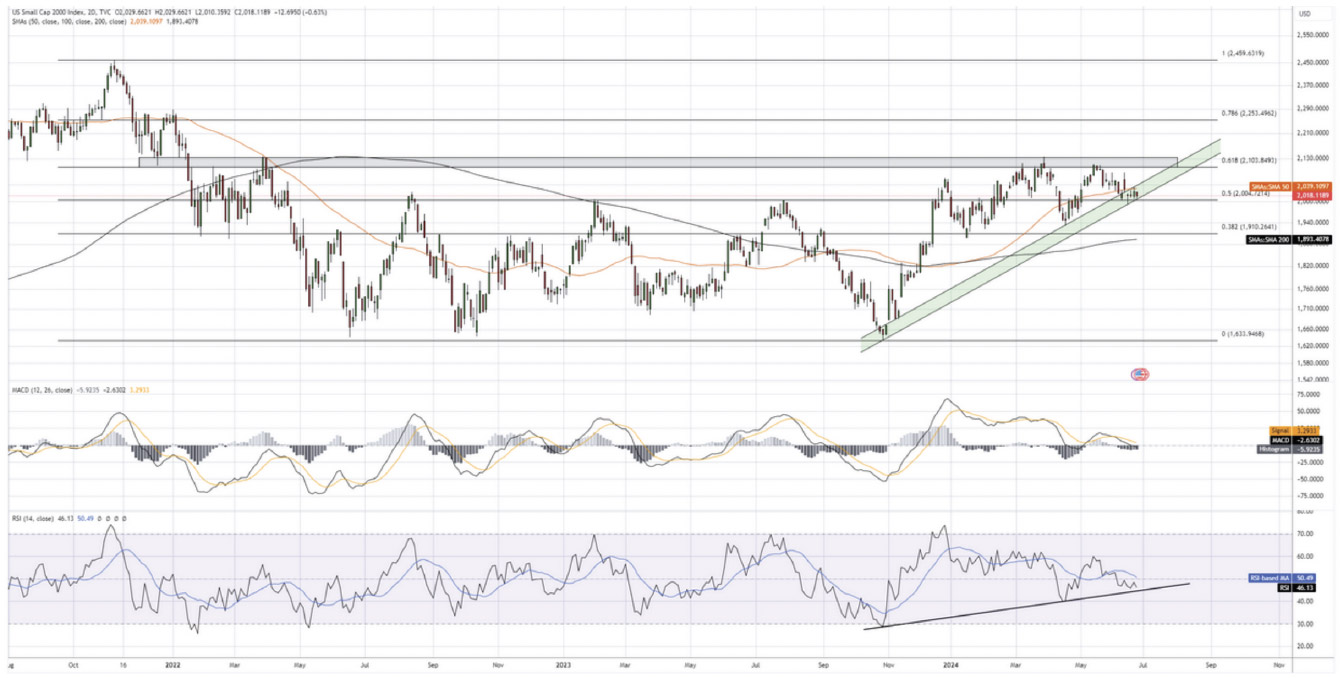
The Russel 2000 posted a quarterly loss of -3.82%, as the laggard within the indices. Small capitalization equities struggled most this quarter, but the technical outlook for the Russel is at a key reversal point along its upward sloping trend line. Seeing the Russel bounce from current levels would likely imply a retest of the 2,700 resistance level which it struggled to breach through in both April and May. A weekly close above 2,700 would put the Russel's next target near 2,250 as this is a key extension level.
Key Technicals
-
• Support zones for the Russel are at current levels near 2,000 along the trend line, followed by 7,925 if the trend line is broken. • RSI for the Russel shows an upward trend with room for extension, as well as MACD hinting at a bullish crossover to come in the short-term. As far as its SO-Day MA, a breach above this would show positive momentum in the near-term.
-
In comparison to other indexes and seeing the Russel lag behind for the quarter, Q3 may see small caps playing catch up to the other indices with room for upside from a technical perspective. Earnings and guidance will also be key.
-
Note that the Russel has yet to fully recover from its all-time high of 2,456 in November of 2027, as the other indices have.
VOLATILITY STATISTICS
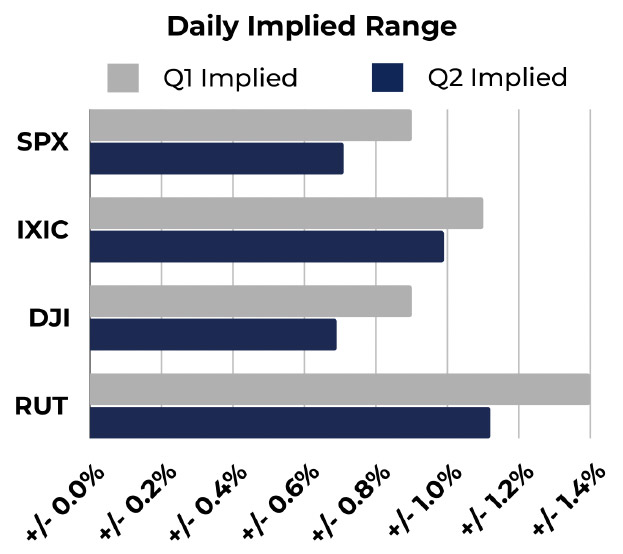
The chart above represents implied daily range per respective index in comparison with calculations from Q7. Values calculated as of6/26/2024.
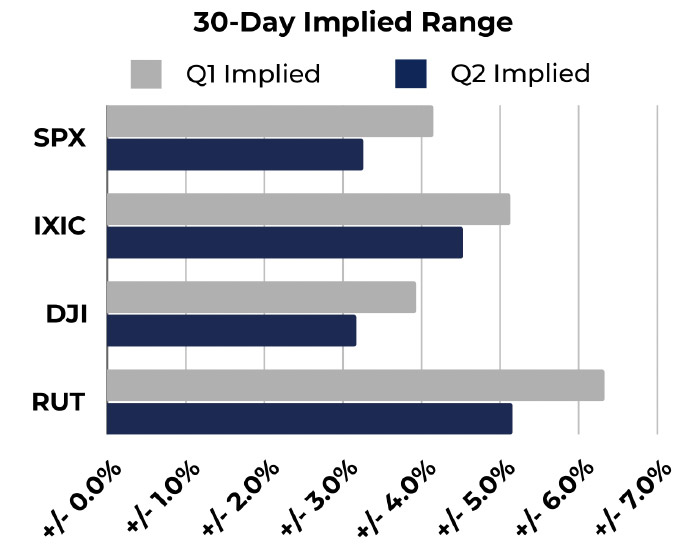
The chart above represents 30-Day implied range per respective index in comparison with calculations from Q7. Values calculated as of6/26/2024.
Looking at volatility in the major indices, the visuals above show underlying volatility index calculations to estimate daily implied ranges as well as 30-Day implied ranges. Calculations from the previous quarter can be seen for comparison, represented by the grey colored bars. Q2 calculations are shown in the blue bars.
- In comparison to the previous quarter, implied range through volatility for all major indices are lower, suggesting less volatility in equities on an intraday and 30-Day forward looking basis.
- Using the most recent volatility metrics, the Russel is expected to be the most volatile index on both an intraday and 30-Day outlook, similar to last quarter.
- The Dow is expected to be the least volatile index on an intraday basis as well as the next 30 days.
SENTIMENT STATISTICS
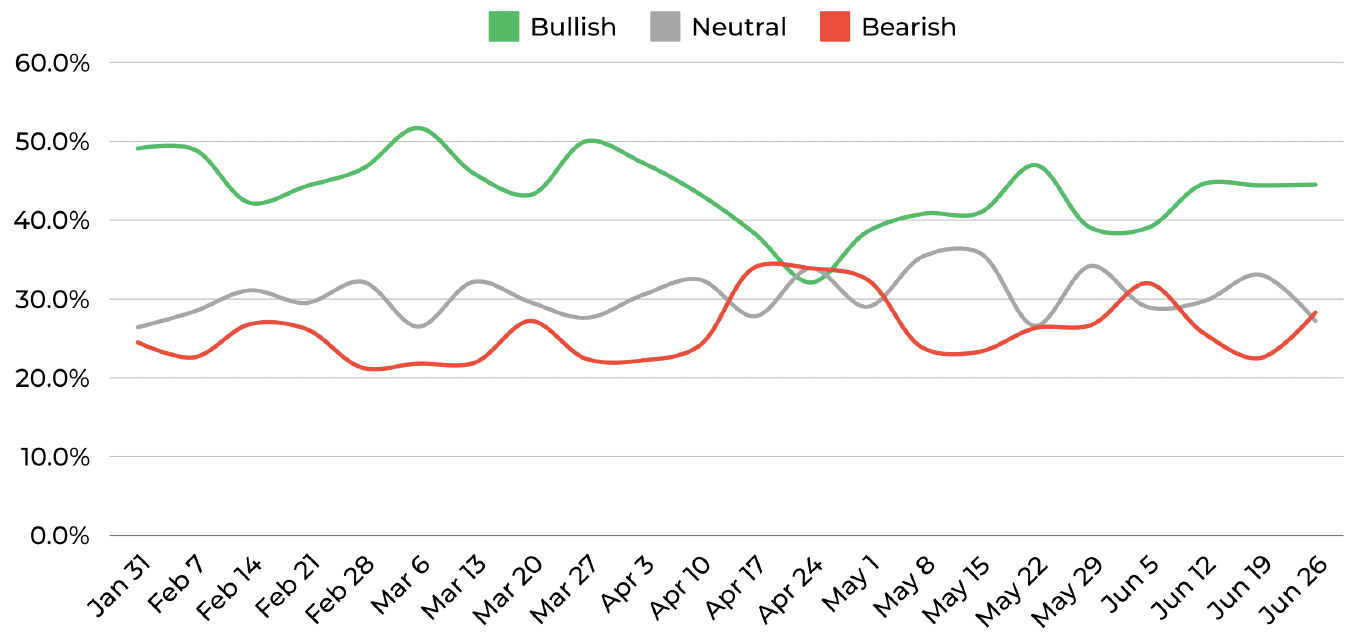
The chart above is a collection of weekly sentiment readings from the American Association of Individual Investors (AAII), gauging investors outlook on equity markets for the following 6 months. www.aaii.com/sentimentsurvey
Looking at other key metrics that measure sentiment and momentum, the most recent sentiment survey (conducted on 6/26/24) shows investor confidence remains bullish in the majority. This is above the historical average of 37.5% for bullish sentiment. In comparison to previous weeks, sentiment has risen from early June. Throughout the second quarter, equities have also substantially recovered from low bullish readings seen at the end of April as markets cooled off, where bearish sentiment hit year-to-date high at 33.9%. Subsequent to this reading, markets continued to rally to record highs, providing further evidence of a long-term bullish trend.
MOMENTUM STATISTICS
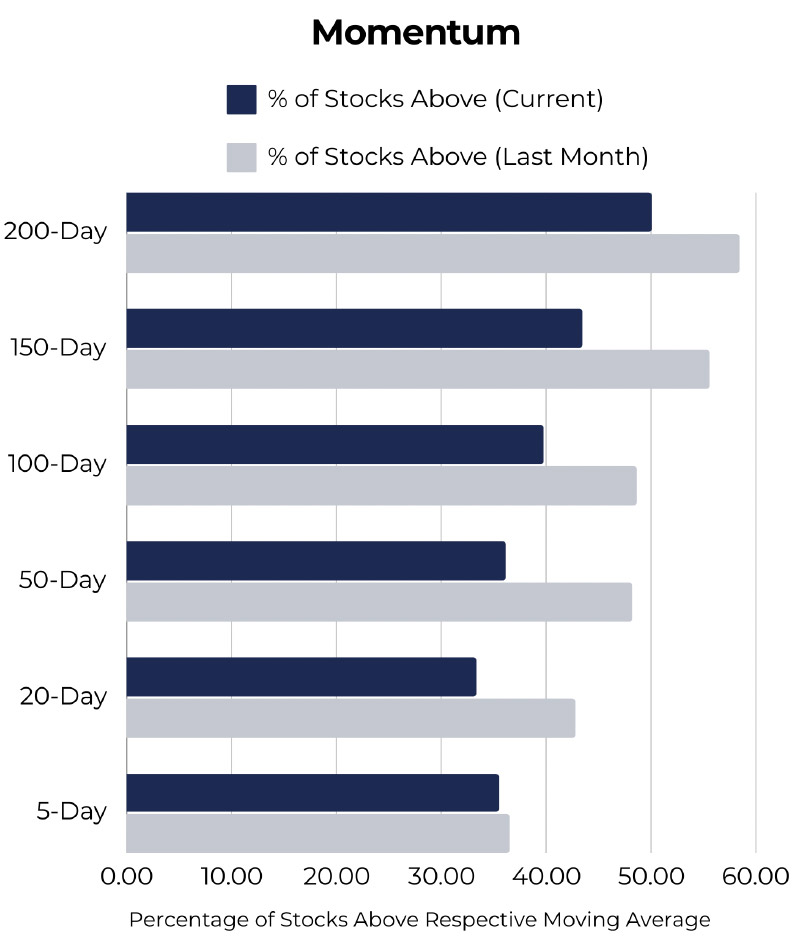
Included on the chart on the left are percentages of stocks that remain above their respective moving averages. In order to further gauge market internals, we can compare the most current reading to data from the prior month. When high percentages of stocks are above their respective moving averages, it is a positive sign that a market uptrend is valid.
- Despite a drop in the percentage of stocks above these moving averages, we see a large percentage of equities remaining above respective MA's.
- Equities have been resilient in maintaining their upward trend in recent weeks
- Lower readings in this data combined with indexes making record highs, suggests equities are not at extreme levels.
Values calculated as of6/26/2024.
Disclosure
This report has been prepared as a matter of general information regarding market conditions, it is not a complete description of any security or company mentioned and is not an offer to buy or sell any securities. All facts and statistics are from sources believed reliable, are not guaranteed accuracy. Transactions may be effected which are inconsistent with research reports. The views expressed herein accurately reflect personal views.
-
This is not an offer to sell or the solicitation to buy any security in any jurisdiction where such offer or solicitation would be legal.
-
Clients should consider whether any advice or recommendation is suitable for their particular circumstances and, if appropriate, seek professional advice, including legal and tax advice.
-
The information is deemed to be defined as Technical Analysis and is not defined as a Research Report under Rule 2241.
45 Broadway, 19th Floor New York, NY 1006 | Tel 212 293 0123 | 877 772 7818 | Fax 212 785 4565
www.spartancapital.com | Member of Finra | SIPC | MSRB Registered