Linea Mercati Interview 4/9/24
April 10, 2024Linea Mercati Interview 4/10/24
April 11, 2024TECHNICAL OUTLOOK & STATISTICS
GIANPAOLO RAFFO | 4 APRIL 2024
Introduction
As the first quarter concluded last week, breaking down sector and index performance to better understand momentum and sentiment, may provide insight to the second quarter of 2024. In this report, major indices and sector specific performance will be discussed with key statistics and visualizations of market movement to summarize Q1 of 2024.
Q1 2024 PERFORMANCE GLIMPSE
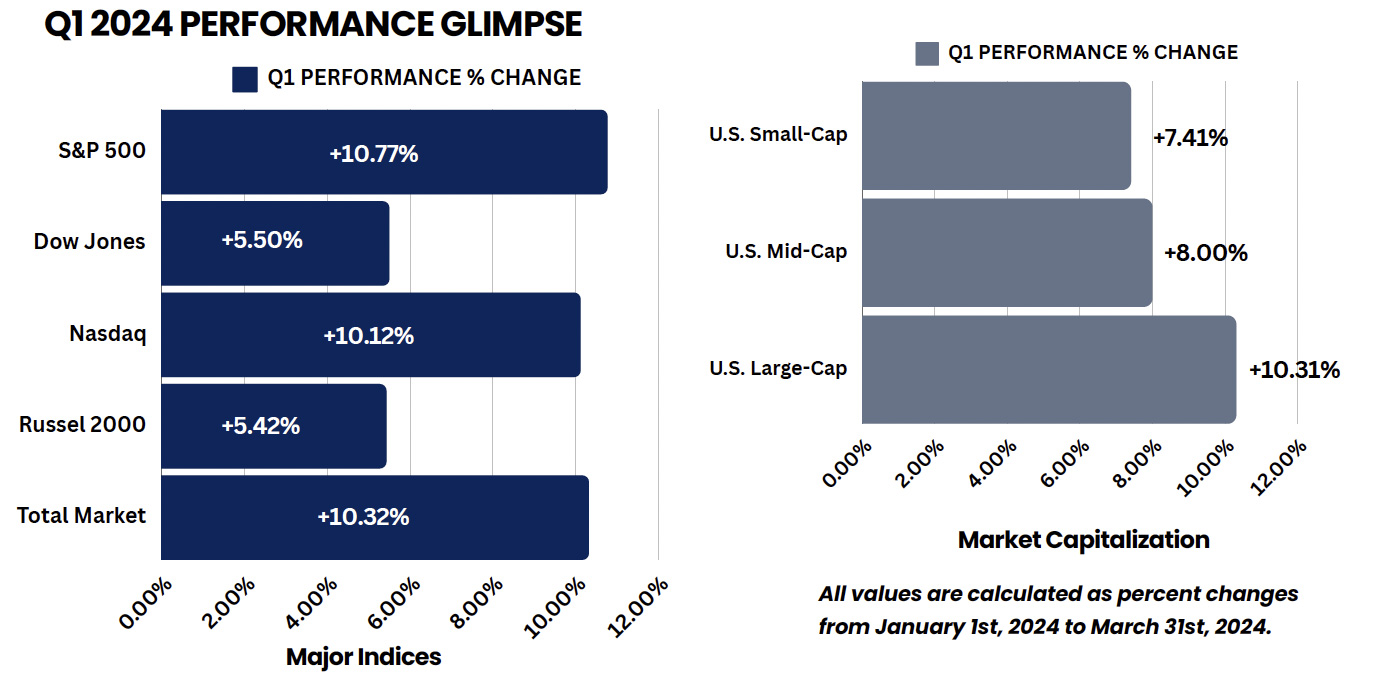
In terms of major indices, the S&P 500 led in terms of percentage gains, followed by the Nasdaq with performance on par with the S&P just slightly below by 0.55%. The Dow and Russel 2000 also had a positive quarter with performance slightly over 5%, but lagging behind the S&P and Nasdaq. In terms of market capitalization, all categorizations had strong performance with U.S. small + medium caps up approximately 8%, while U.S. large caps led in percent gains with quarterly performance of 10.31%.
S&P Sector Overview
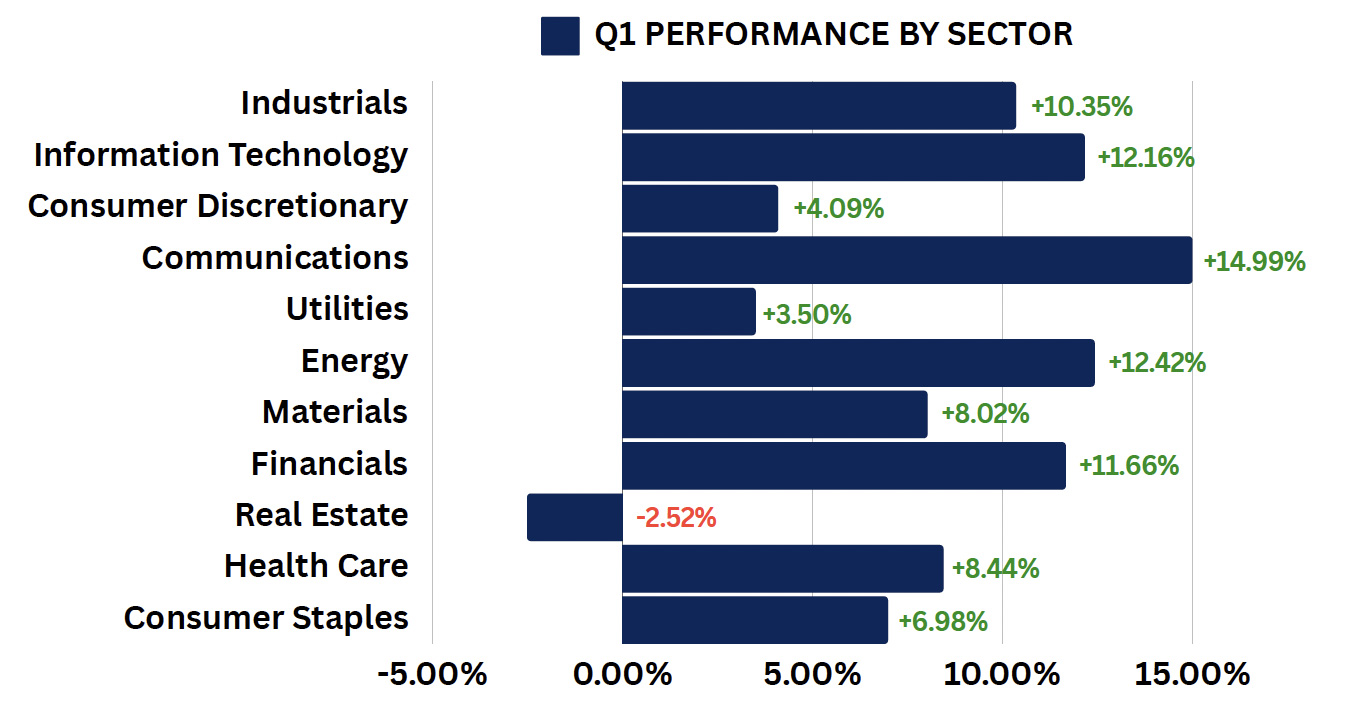
The chart above includes S&P Indexes by Sector and their quarterly performance for Q1 2024
-
Leading sectors for the quarter include Communications, Energy, Information Technology, Financials and Industrials. All gaining between 10%-15% for Q1.
-
Other sectors with positive performance for the quarter but lower than its leaders include Health Care, Materials, Consumer Staples, Consumer Discretionary, and Utilities.
-
The only negative sector for the quarter was Real Estate, showing sector outflow in percentage terms at -2.52%.
S&P 500 INDEX - SPX
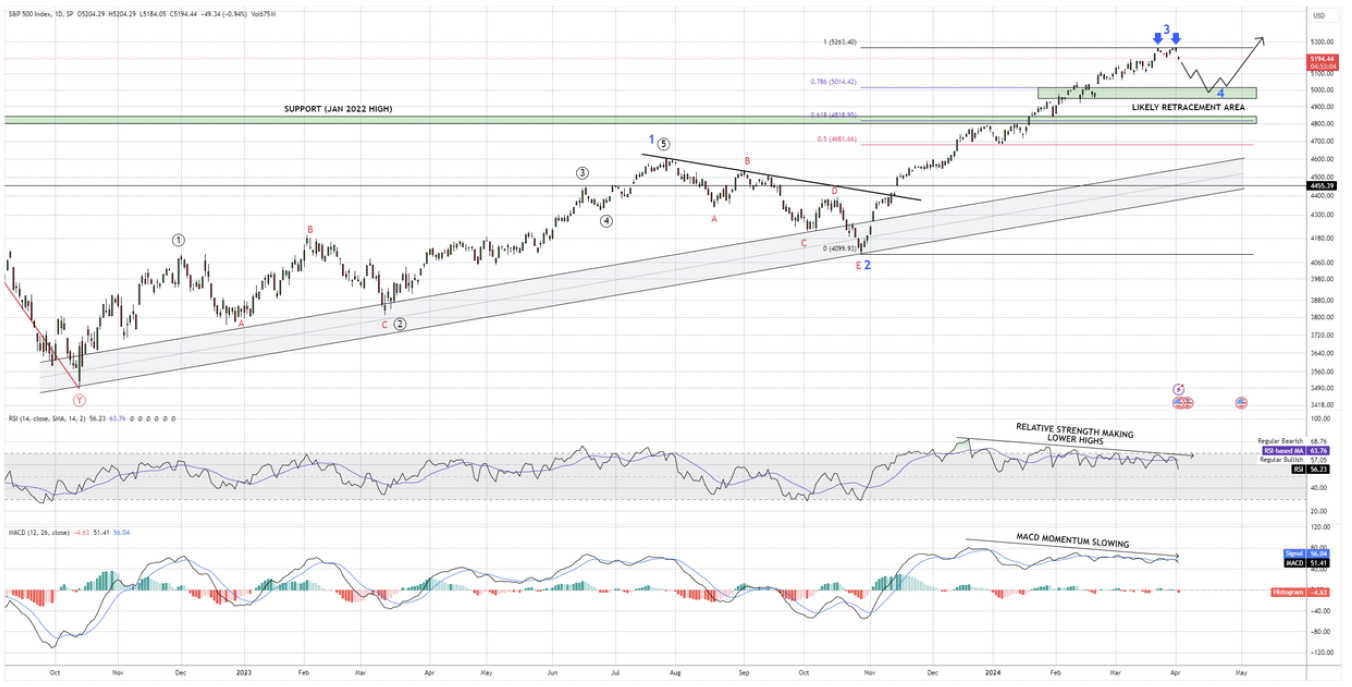
The S&P 500 finished the first quarter strong with percentage gains slightly over 10%. Since the beginning of 2024, the S&P has had little to no resistance/corrections since breaching previous all-time highs. This being said, the long-term picture remains bullish but technical indicators and momentum suggest a short-term pullback of around 3%. A healthy retracement to approximately 5000 would serve as the next support level, also allowing a gap fill to occur before moving into Wave 5.
Key Technicals
- Support levels for the S&P are respectively 5,000, followed by 4850 which is the all-time high level from Jan. 2022.
- MACD and RSI are diverging from price action as the market continued to make new highs, this discrepancy between key indicators and price action suggests declining market breadth/momentum in the short-term.
- Elliot Wave Theory suggests Wave 3 within our 5 Wave sequence has been completed. Although Wave 4 is a corrective wave, they tend to have shallow retracements, meaning a pullback to 5,000, followed by a 5th bullish wave is a likely path.
DOW JONES INDUSTRIAL AVERAGE - DJI
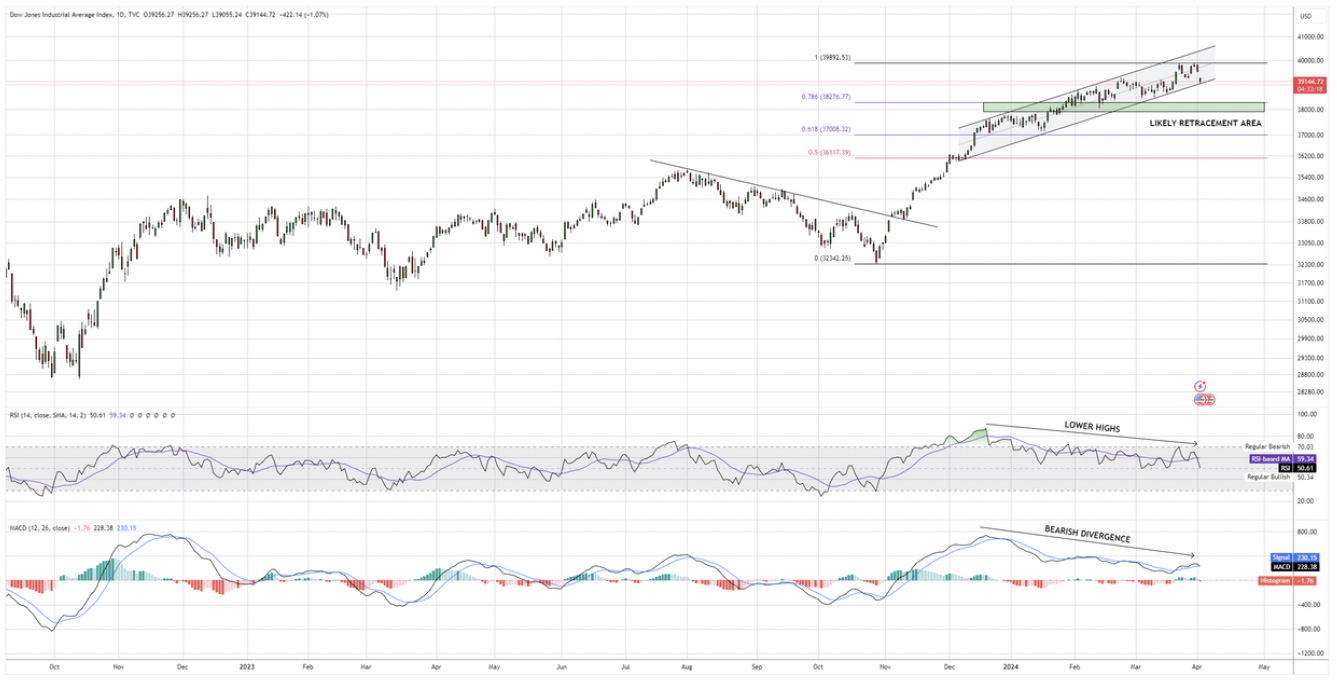
The Dow Jones concluded first the first quarter with gains near 5.5%, although percentage gains are lower than the S&P and Nasdaq, the Dow also breached above previous all-time highs, providing a bullish psychological factor in the rally. Technical outlook for DJI also hints at slowing momentum / breadth, where a retracement of 2%-3% near the 38,300 level is support.
Key Technicals
- Support levels for the Dow are respectively 38,300, followed by 37,800, and lastly near 37,100.
- MACD and RSI are diverging from price action as the market continued to make new highs, this discrepancy between key indicators and price action suggests declining market breadth/momentum in the short-term.
- In the short term on this daily chart, we can observe an intraday double-top occurring last week, where the Dow struggled to breach above the 39,900 price level. Although the outlook in the short-term is relatively bearish in the technical perspective, a healthy pullback before a continuation of positive movement is a likely case-scenario.
NASDAQ - IXIC
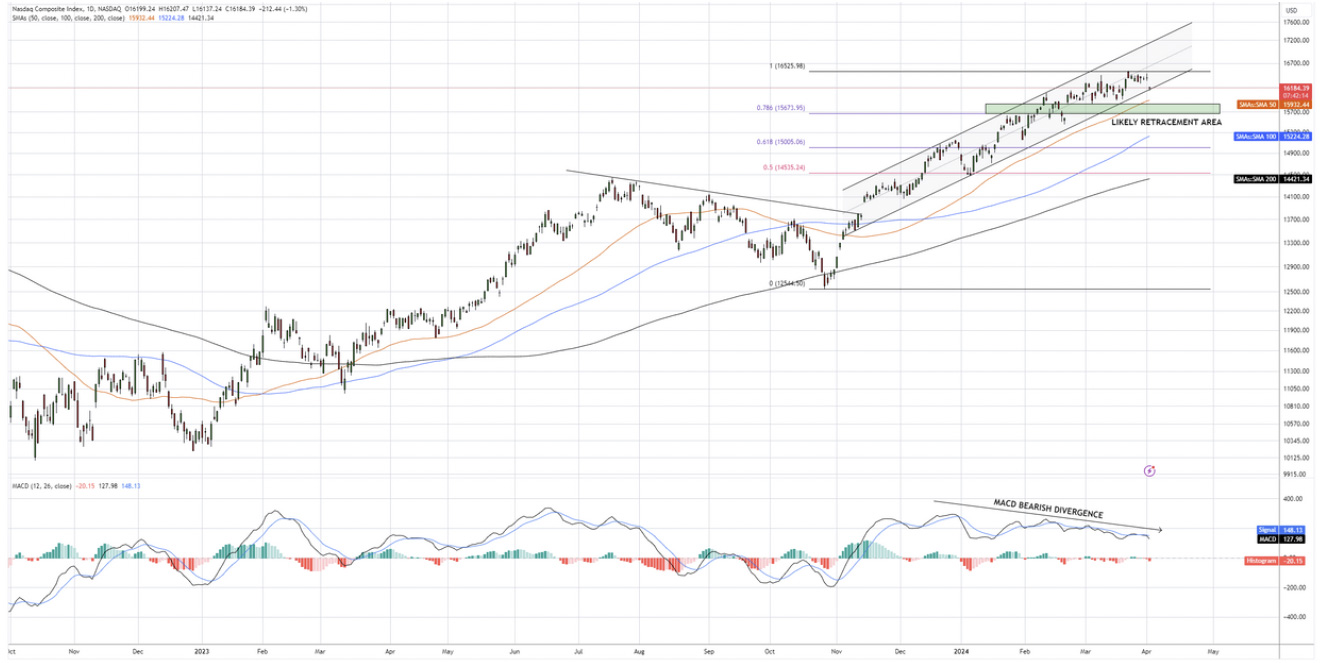
The Nasdaq finished the first quarter of 2024 similarly to the S&P, with gains slightly above 10% just behind the S&P as the Q1 leading index. The technical outlook and current internals are very similar to its S&P counterpart.
Key Technicals
- Support zones for the Nasdaq include the 16,000 level, followed by the 15,600 area where the gap in the chart occurs.
- MACD and RSI are diverging from price action as the market continued to make new highs, this discrepancy between key indicators and price action suggests declining market breadth/momentum in the short-term.
- In terms of retracements, seeing the Nasdaq not able to breach above the 16,500 level may indicate a slight short-term reversal from current levels. A healthy pullback between 3%-4% is a level where the market would find support, also filling the gap left behind from Feb. 21st, 2024. Despite short-term indicators and weakening internals, the long-term outlook for the Nasdaq remains bullish as break outs from previous all-time highs and sentiment provide a positive outlook.
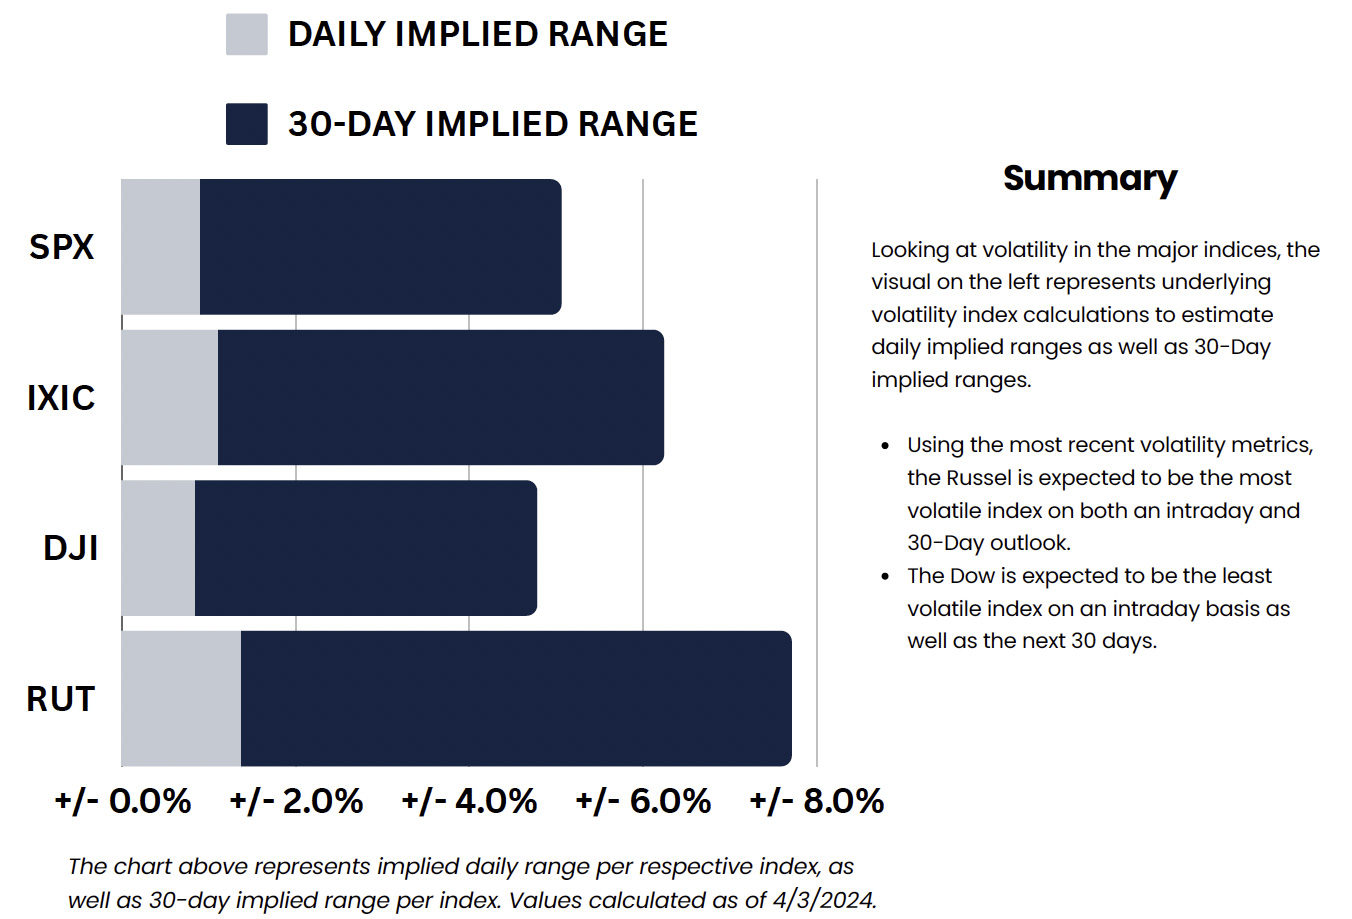
Volatility Statistics
Momentum & Sentiment Statistics
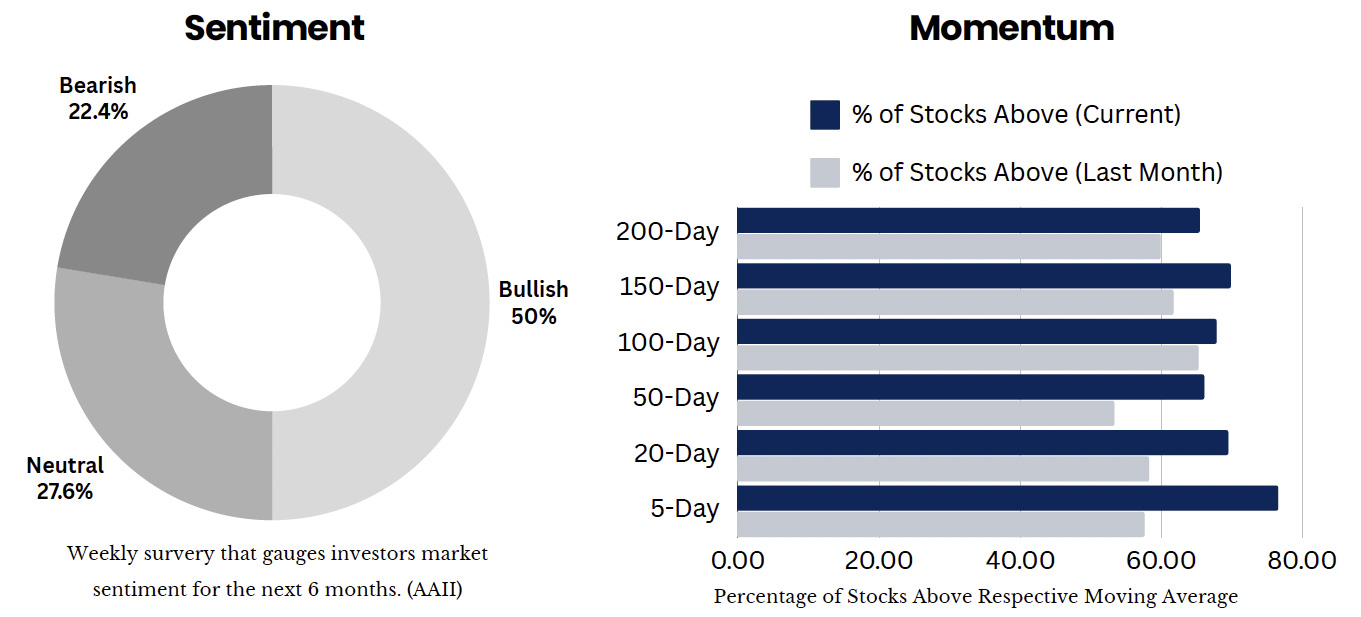
Looking at other key metrics that measure sentiment and momentum, the most recent sentiment survey (conducted on 3/27/24) represents investor confidence for bullish movement. The 52-week high for bullish sentiment was 52.9% for the week ending 12/20/2023, followed by a significant rally in indices to break all-time highs in the S&P over 4800 as well as the Nasdaq over 16,200. Although sentiment does not provide full confirmation, strong bullish outlook is a positive indication for bullish continuation within the next 6 months.
Included on the chart above are percentages of stocks that remain above their respective moving averages. We can observe that over 60% of stocks currently remain above their respective moving averages. Compared to a month ago (grey shaded bars above), percentages of stocks; for all listed moving averages, has increased, representing positive momentum in the majority.
Disclosure
This report has been prepared as a matter of general information regarding market conditions, it is not a complete description of any security or company mentioned and is not an offer to buy or sell any securities. All facts and statistics are from sources believed reliable, are not guaranteed accuracy. Transactions may be effected which are inconsistent with research reports. The views expressed herein accurately reflect personal views.
-
This is not an offer to sell or the solicitation to buy any security in any jurisdiction where such offer or solicitation would be legal.
-
Clients should consider whether any advice or recommendation is suitable for their particular circumstances and, if appropriate, seek professional advice, including legal and tax advice.
-
The information is deemed to be defined as Technical Analysis and is not defined as a Research Report under Rule 2241.
45 Broadway, 19th Floor New York, NY 1006 | Tel 212 293 0123 | 877 772 7818 | Fax 212 785 4565
www.spartancapital.com | Member of Finra | SIPC | MSRB Registered