Linea Mercati Interview 4/3/25
April 4, 2025Market tariff fallout continues as Powell says Fed still in wait and see mode
April 4, 2025Technical Outlook & Summary Statistics
GIANPAOLO RAFFO - TECHNICAL MARKET STRATE GIST | APRIL 3, 2025
Performance Glimpse
As the final quarter concluded on Monday, March 31st, this report breaks down sector and index performance to better understand momentum, sentiment, and may provide insight to the second quarter of the year. In this overview, major indices, precious metals, sentiment, momentum, volatility and sector specific performance will be discussed with key statistics and visualizations of market movements to summarize Q1.

For the first quarter of 2025, all major indices posted quarterly losses. Indices such as the Nasdaq, S&P, and Dow Jones all reached either new highs or near it in January and February, and have since then fallen from these levels. The Russel was the worst performer of the group, followed by the Nasdaq, both being the most volatile indices of the group. The S&P posted a quarterly loss of 4.47%, followed by the Dow Jones with the least decline under 2%. Economic and political uncertainty played a large role in Ql performance, as most indices entered correction territory (down over 10% from the highs), including the S&P, Nasdaq, Russel, and the Dow just under 10% from the January highs.

In terms of market capitalization, the first quarter saw the largest outflows in small-caps followed by large-cap equities. With losses between 6%-7%. Mid-caps showed the least decline with losses of 2.49% for Q1. After well above average performance in 2024 for equity markets, the correction in markets is one that we do not expect to erase gains made throughout the prior year.
Q1 Sector Performance

The chart above includes S&P Indexes by Sector and their quarterly performance for Q1 2025 ...
• Leading sectors for the quarter include Energy as the top performer, followed by Health Care, Consumer Staples, and Utilities with positive performance for the first quarter of the year.
• Financials, Real Estate, and Materials were also positive for the quarter but with performance between 1%-2%.
• Other sectors saw noteworthy outflows for the quarter including losses for Industrials, Communication Services, and more significantly, Information Technology and Consumer Discretionary with major outflows between -13% and -15%.
S&P 5OO - SPX

Key Technicals
• Support levels for the S&P are respectively 5,400, followed by 5,275.
• Resistance Levels include 5,775, followed by 5,950, and lastly 6,100 near the highs of February.
• Multiple instances of reversals, both short and long term have been seen when the S&P reaches these oversold levels as highlighted above. Positive reactions to both political current events, and earnings could serve as a catalyst for relief.
• The current tariff situation in combination with an upcoming earnings season will likely determine whether a relief rally for equities from these lows is attainable
Dow Jones Industrial Average - DJi
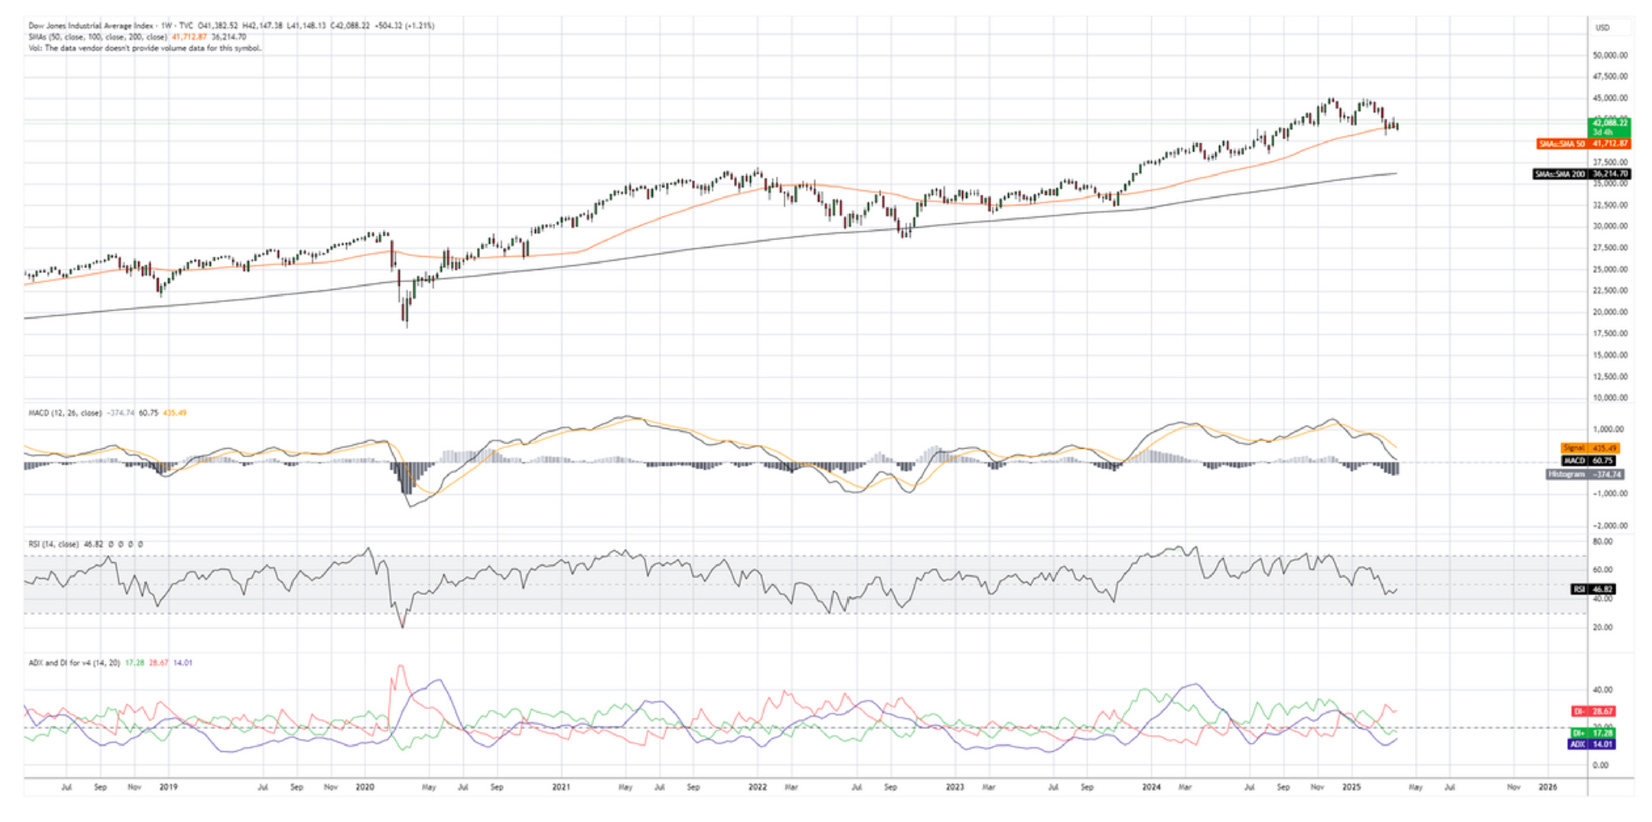
The Dow Jones Industrial Average closed at 42,001 for the first quarter of the year, posting a loss of -l.45%. Similar to the S&P 500 and other indices, the index fell as much as 9.75% from late January highs. The index currently sits slightly above the SODay moving average, a key technical support level. A breach of the previous lows seen in the beginning of March would likely imply continued volatility for the index as external political factors influence both outlook and volatility. Key Technicals
Key Technicals
• Support levels for the Dow are 40,650 (SO-Day Moving Average), followed by approximately 40,000.
• The Dow Jones sits just near oversold levels, continued support at the current SO-Day moving average on a weekly timeframe as shown above, would serve as a positive indication of a relief rally. A close below the SO-Day on a weekly timeframe would indicate broken support and likely lower movement
• The Dow Transportation Index (DJT) is a leading indicator for the index, a key index to observe in the coming weeks.
• The current tariff situation in combination with an upcoming earnings season will likely determine whether a relief rally for equities from these lows is attainable.
NASDAQ Composite lndex - IXIC

Key Technicals
• Support zones for the Nasdaq are approximately 16,SOO, followed by lS,72S, and at the 200-Day MA on the weekly 14,600.
• Resistance levels for the index are respectively l8,4SO at the 200-Day moving average on daily timeframe, and l8,77S at the SO-Day moving average on a daily time frame.
• Note that the SO-Day moving average crossing below the 200-Day moving average would likely imply further bearish movement for the index and tech outflows may persist in the coming months.
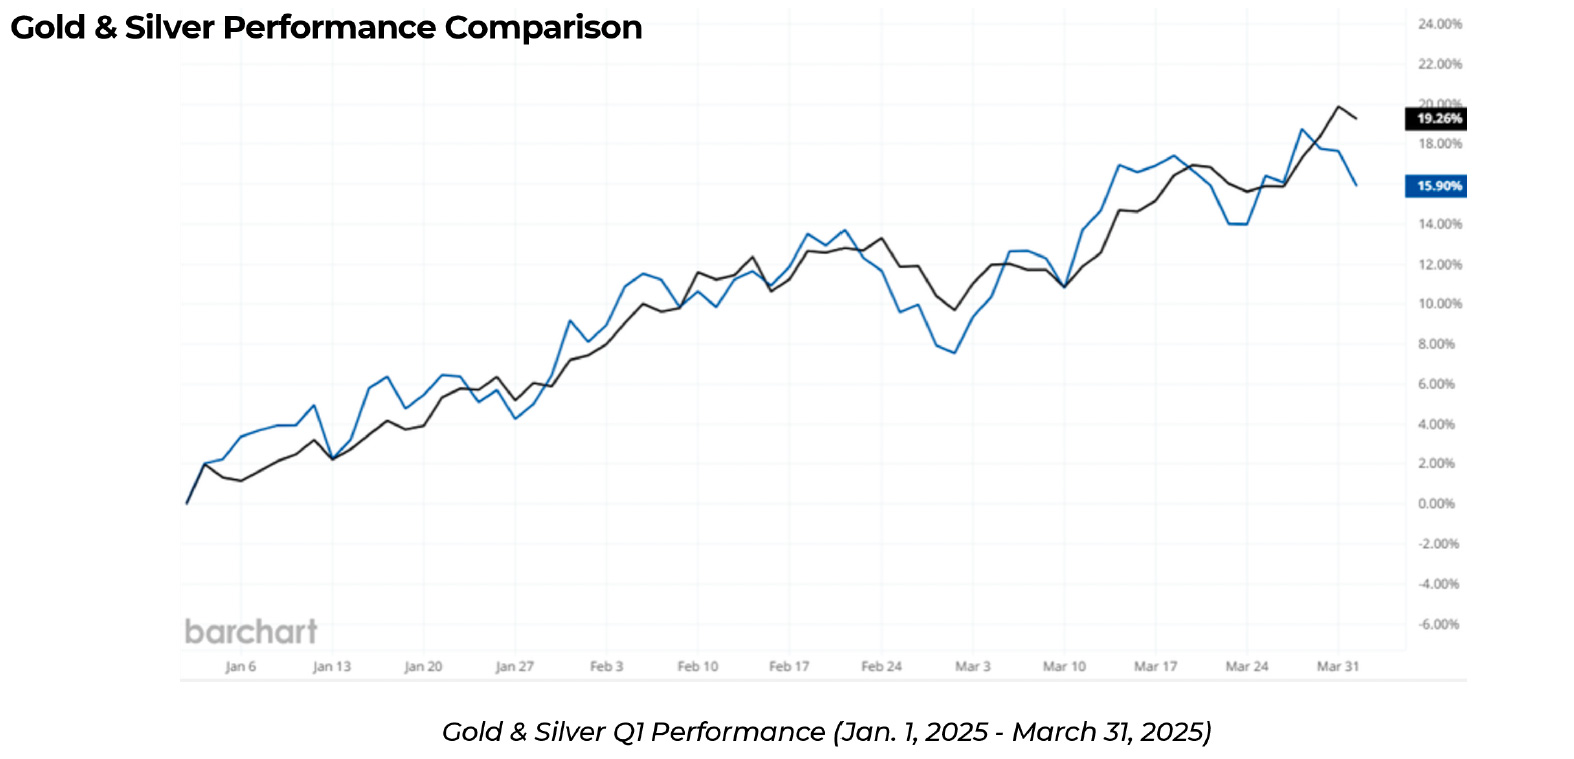
Precious Metals
Other than equity index performance, precious metals, specifically Gold and Silver had noteworthy performance in Q1.
Other than equity index performance, precious metals, specifically Gold and Silver had noteworthy performance in Q1.
• Gold has shown one of the strongest bullish trends seen in decades for the metal, with the best quarterly performance seen since the 1980's.
• The metal posted a quarterly gain of 19.22% now trading above the key psychological $3,000/oz level. We expect gold to continue to outperform as economic factors and current political landscape serve as a reason to own the metal.
Silver also had a positive quarter, posting gains of 15.87%, slightly behind its gold counterpart. Both metals should continue this trend backed by both technical and fundamental reasoning in the long term.

Sentiment Statistics

Looking at other key metrics that measure sentiment and momentum, the most recent sentiment survey (conducted on 3/26/25} shows investor confidence has significantly shifted to a majority bearish since the beginning of February. With the highest bearish reading of 60.60% in late February, sentiment readings show some gradual decline to near 50% as well as a slight increase in bullish sentiment in the most recent week.
A sentiment analysis showed that historically, when bearish sentiment readings were over 50%, performance over the following 3-6 months were above average for the S&P and other major indices. While the short-term volatility and "fear" index may be nearing extreme levels, data shows that long-term performance after these type of corrections in equity markets remains intact. Seeing markets rebound in the coming weeks from extreme levels, with sentiment shifting in the following weeks may indicate some recovery from these losses in the indices.
Market Momentum Statistics

Included on the left are percentages of stocks that remain above their respective moving averages. In order to further gauge market internals, we can compare the most current reading to data from the prior month. High percentages of stocks are above their respective moving averages is a positive sign of bullish momentum.
• Momentum in the long-term averages has declined significantly in the most recent quarter in comparison to momentum seen at the end of 2024.
• Despite this, equities trading below their respective 200-Day moving averages can represent ideal buying opportunities for longer term time horizons with the potential for a reversion to the mean.
• For signs of a momentum shift, we want to see an increase in stocks trading above the higher moving averages, (SO-Day, 100-Day, 150-Day, and 200-Day).
Disclosure
This report has been prepared as a matter of general information regarding market conditions, it is not a complete description of any security or company mentioned and is not an offer to buy or sell any securities. All facts and statistics are from sources believed reliable, are not guaranteed accuracy. Transactions may be effected which are inconsistent with research reports. The views expressed herein accurately reflect personal views.
-
This is not an offer to sell or the solicitation to buy any security in any jurisdiction where such offer or solicitation would be legal.
-
Clients should consider whether any advice or recommendation is suitable for their particular circumstances and, if appropriate, seek professional advice, including legal and tax advice.
-
The information is deemed to be defined as Technical Analysis and is not defined as a Research Report under Rule 2241.
45 Broadway, 19th Floor New York, NY 1006 | Tel 212 293 0123 | 877 772 7818 | Fax 212 785 4565
www.spartancapital.com | Member of Finra | SIPC | MSRB Registered