Linea Mercati Interview 1/3/25
January 6, 2025Linea Mercati Interview 1/7/25
January 7, 2025CIANPAOLO RAFFO
JANUARY 3, 2025
Performance Glimpse
As the final quarter concluded on Tuesday, December 31st, this report breaks down sector and index performance to better understand momentum, sentiment, and may provide insight to the new trading year in 2025. In this overview, major indices, precious metals, sentiment, momentum, volatility and sector specific performance will be discussed with key statistics and visualizations of market movements to summarize Q4 as well as the overall 2024 fiscal year.

In terms of major indices, 2024's index leader was the Nasdaq, posting annual gains of 29.84%. The S&P 500 followed as second best, posting gains of 23.95% for the year, significantly higher than the index's average annual return. (70.73% average return since 7957). The Dow and Russel indices both ended the year with positive performance as well, with the total market index up 22.14% for 2024.

For the fourth and final quarter of the year, all major indices were in positive territory in terms of percentage gained. The Nasdaq outperformed all other indices substantially, posting a quarterly gain of 6.35% while the S&P 500 closed up 2.07%. The Dow and Russel's performance for Q4 were both under 1% in positive movement, a relatively flat quarter for these indices.
Performance Glimpse
Using the visual below, we can summarize and compare 2024 through quarterly performance within each major index. The chart below includes the Nasdaq, S&P 500, Dow Jones Industrial Average, Russel 2000, and the total stock index which includes small, mid, and large capitalized public companies.

Looking at the quarterly breakdown above, we can see that the strongest quarters for 2024 were Ql and Q3 where all major indexes showed positive above average gains. Q2 and Q4 showed some of the indices remaining positive but overall lower performance from Ql and Q3. The Nasdaq and S&P 500 were the only indices that posted positive gains for all four quarters.
Despite lower gains in the second and fourth quarters, all major indices shown above were able to make new all-time highs during the later part of Q4 as well as post annual gains of over 10% for each respective index.
Quarterly Performance Comparison - Market Capitalization
We can also break down the 2024 fiscal year in terms of market capitalization. Similar to the previous page, performance per quarter in terms of market capitalization can be observed below as well as overall annual performance.
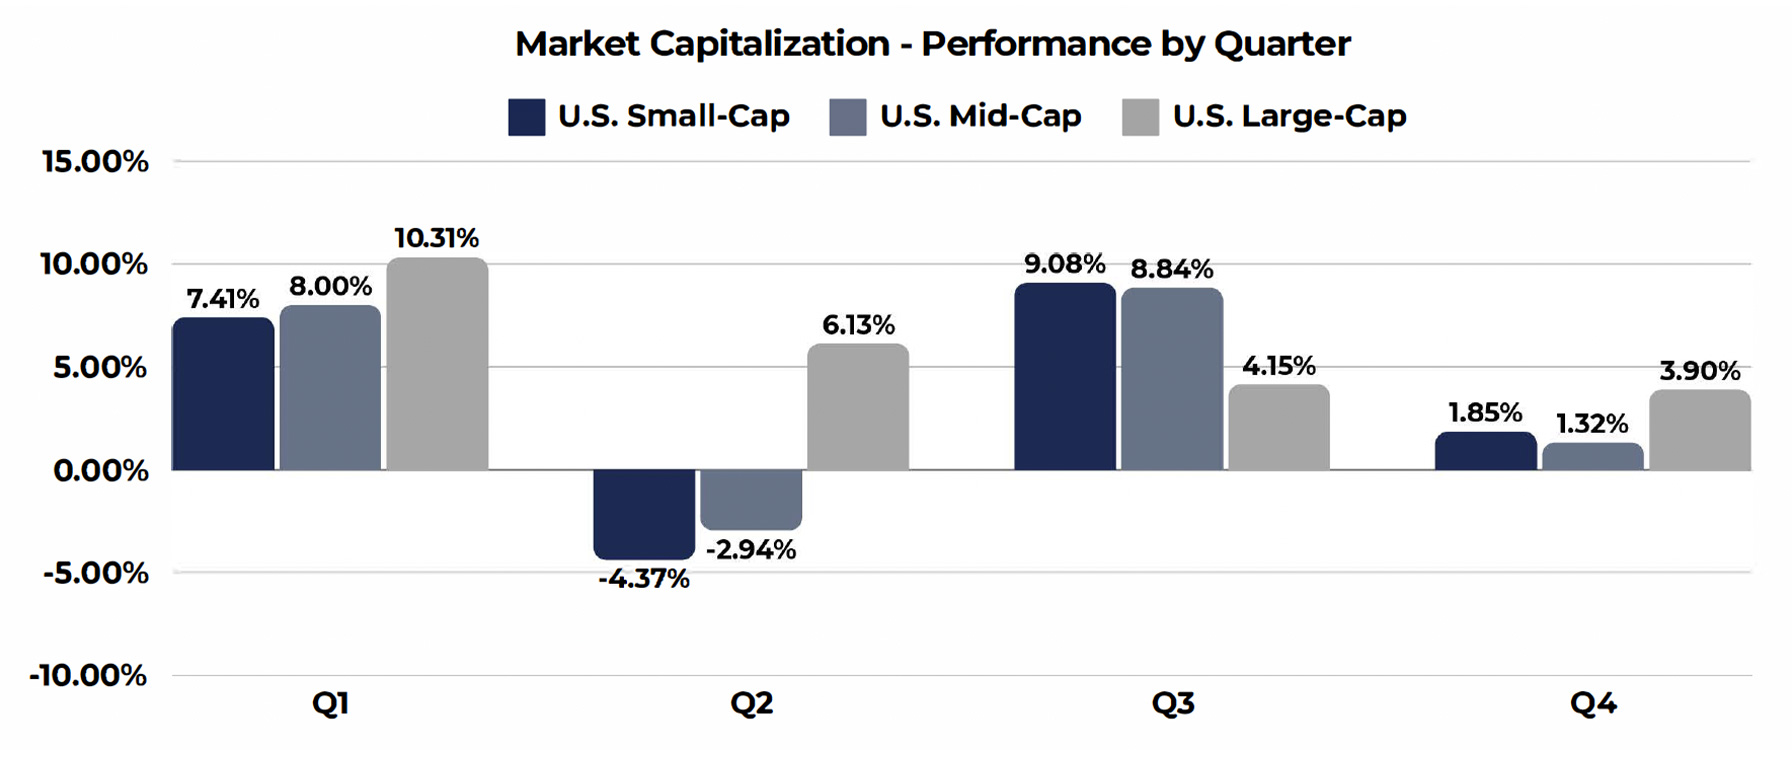
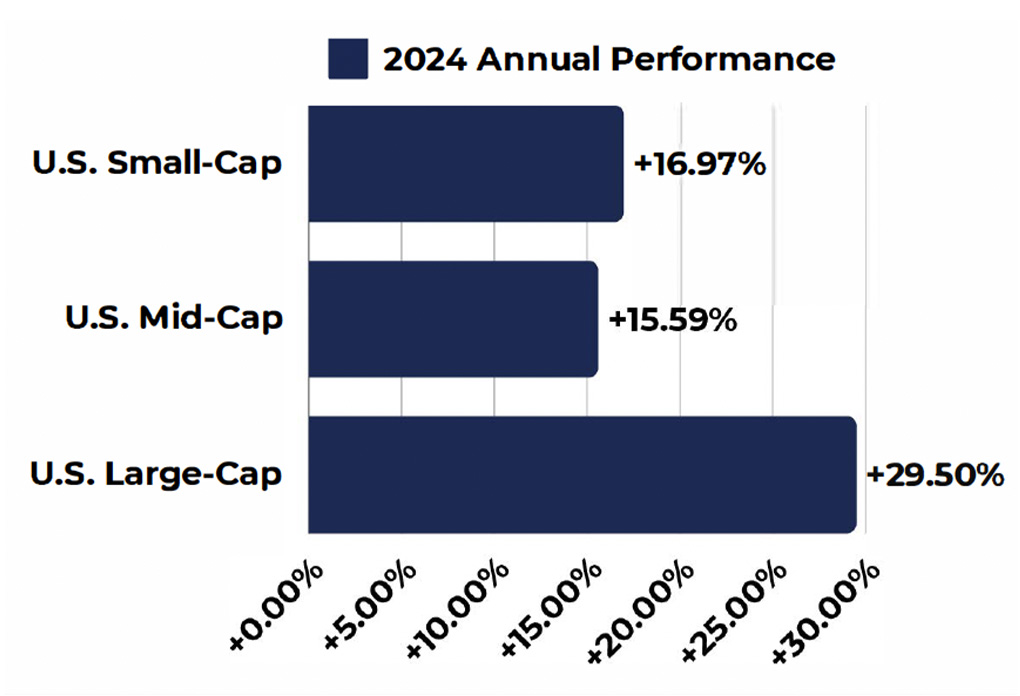
Large caps led for the year in terms of percentage gains, mostly attributed to prominent tech names extending their runs. (Information Technology, Communications, Financials, Artificial Intelligence integration). Small and mid-cap U.S. equities also had a strong year, with small-caps performing slightly better than mid-caps overall, both showing positive inflow with gains over 15% for 2024.
We saw lower gains in comparison to other quarters for the final quarter of the year, but it is important to note that small & mid-cap equities were up over 20% year over year within Q3, but cooled off towards the end of the year.
Q4 Sector Performance
All values calculated as of January 2nd, 2025
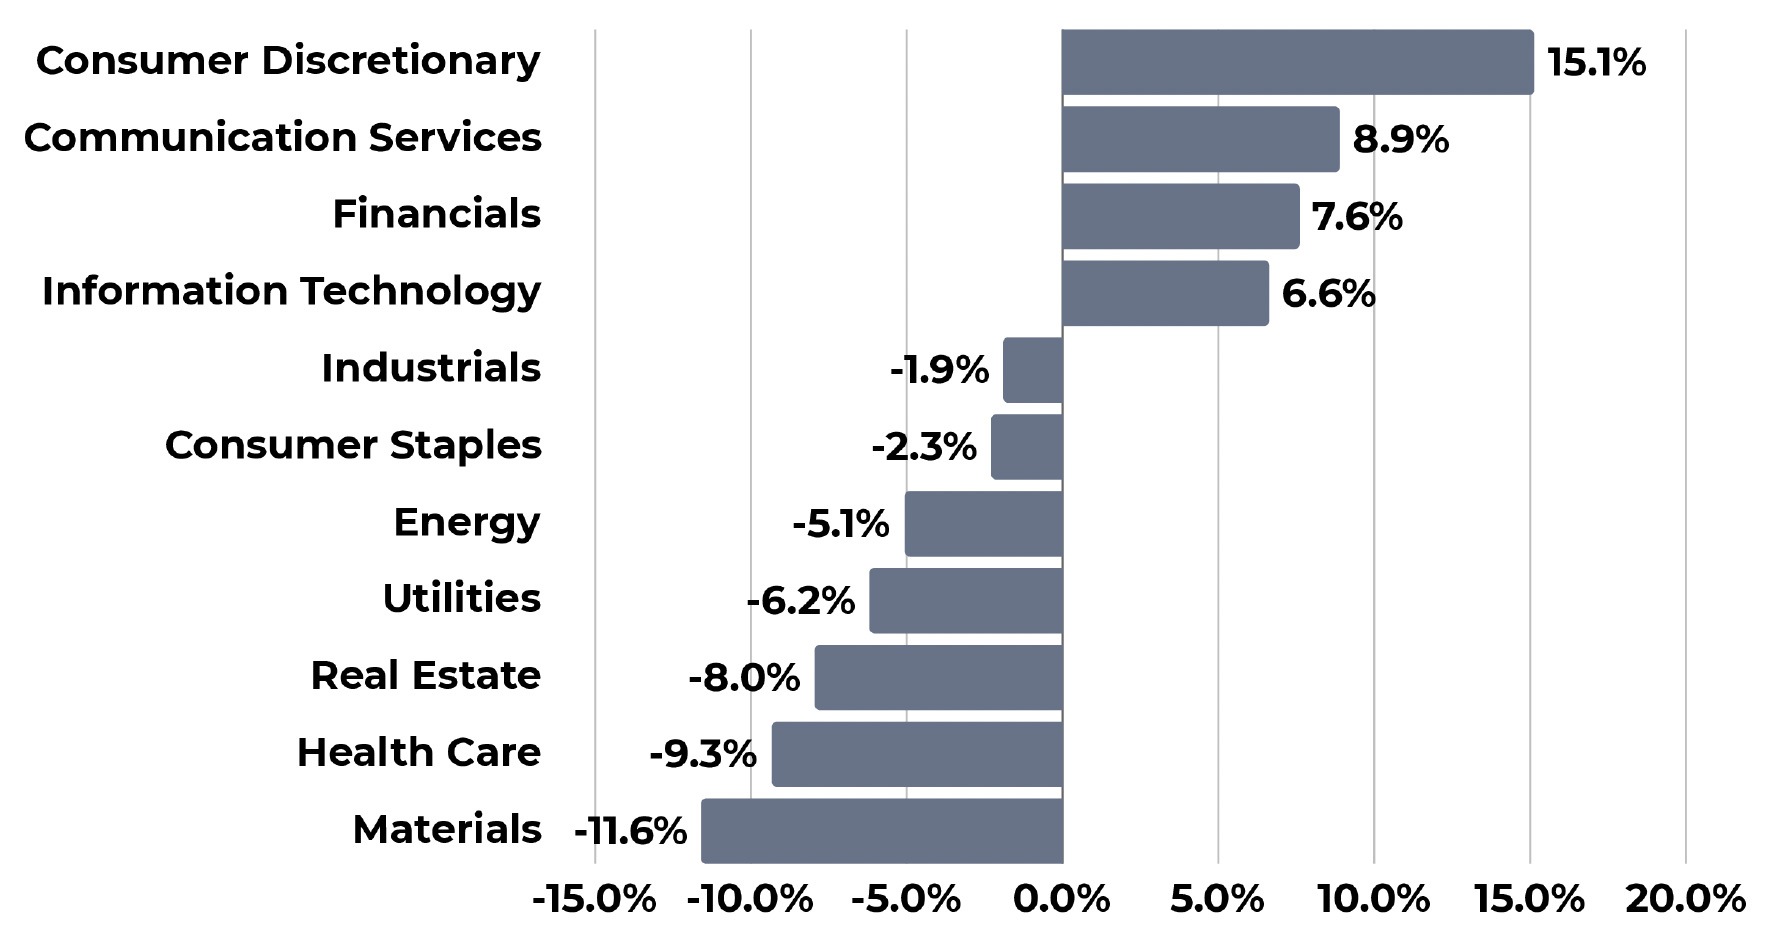
The chart above includes S&P Indexes by Sector and their quarterly performance for Q4 2024 ...
• Leading sectors for the quarter include Consumer Discretionary, Communication Services, Financials, and Information Technology, the only four sectors that were positive for the quarter.
• Other sectors were lower for the final quarter of the year, with Industrials, Consumer Staples, and Energy slightly lower with quarterly loses between -1.0% & -5.0%.
• Other sectors saw noteworthy outflows for the quarter including losses for Utilities, Real Estate, and Health Care. The laggard of the group for Q4 was Materials as the worst performer, closing the quarter down 11.60%.
2024 Annual Sector Performance
All values calculated as of January 2nd, 2025
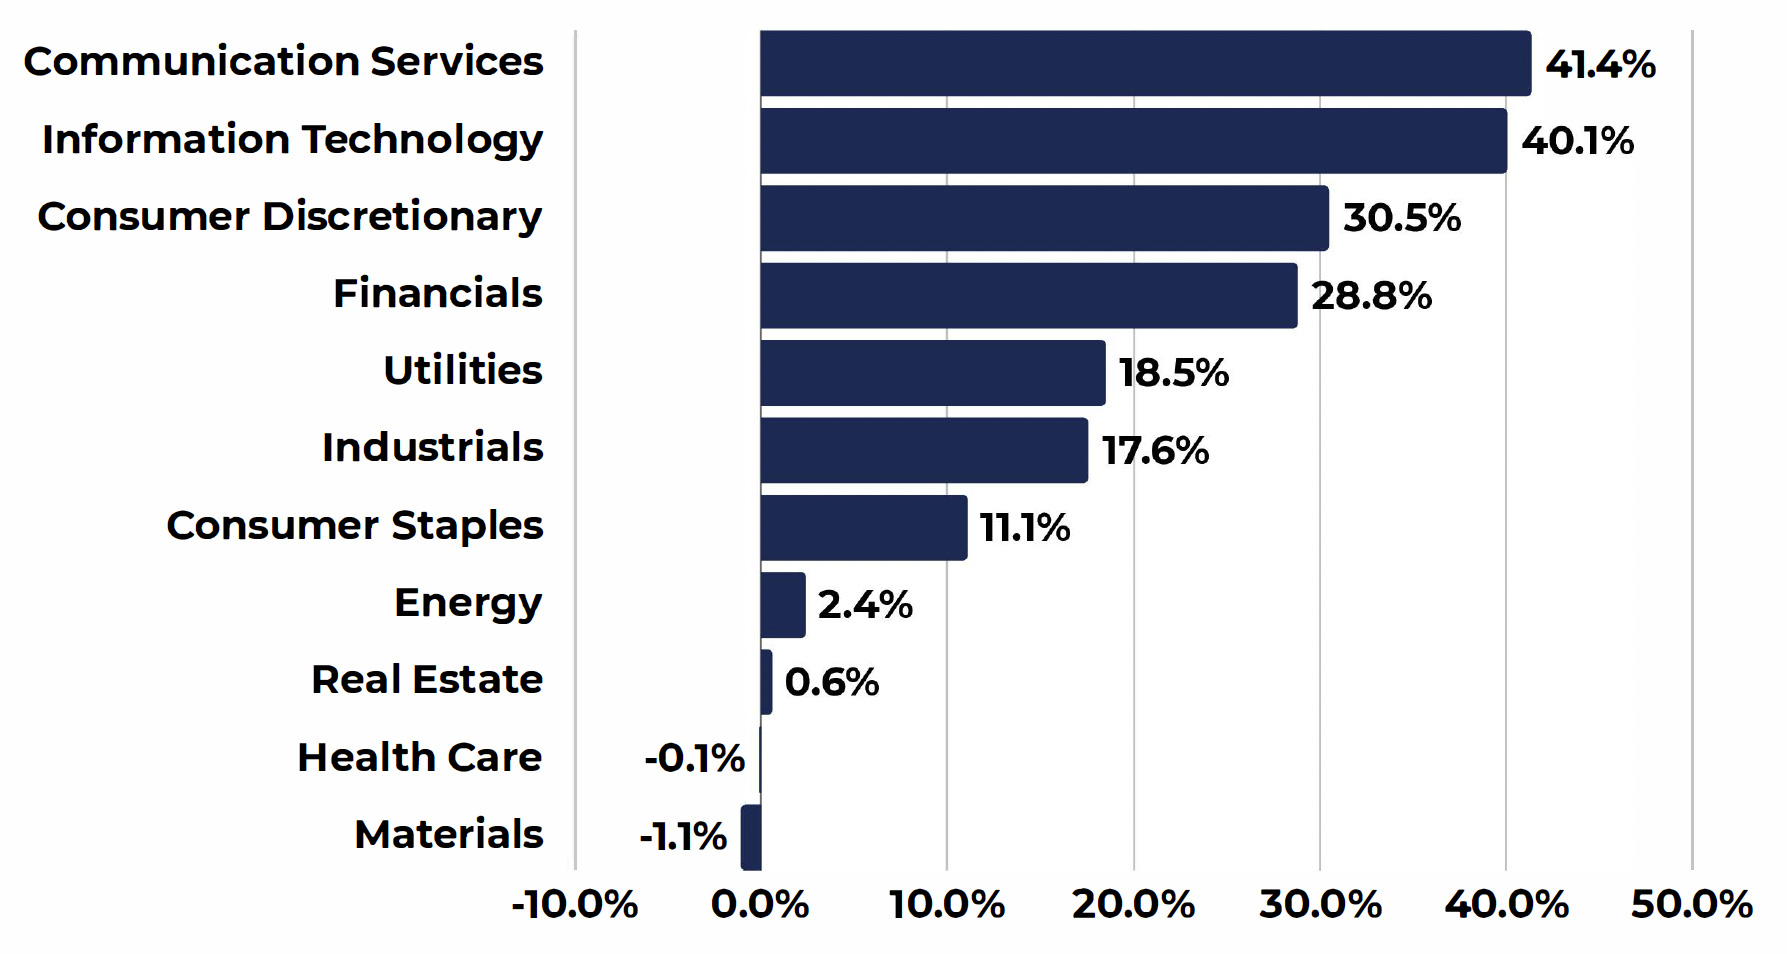
The chart above includes S&P Indexes by Sector and net overall performance for the year of 2024 ...
• Leading sectors for the year include Communication Services and Information Technology as the top performers, both closing the year with posted gains of over 40%. This performance was also seen similarly for both sectors in 2023.
• Other sectors with positive performance but slightly lower than the leaders for the year include Consumer Discretionary, Financials, Utilities, Industrials and Consumer Staples all showing strong inflows throughout 2024.
• Energy was up just under 3% for the year as well as Real Estate performing just above flat after outflows in Q4.
• Health Care and Materials were the only negative sectors for the year, but not significantly with loses just at or below 1%.
Volatility
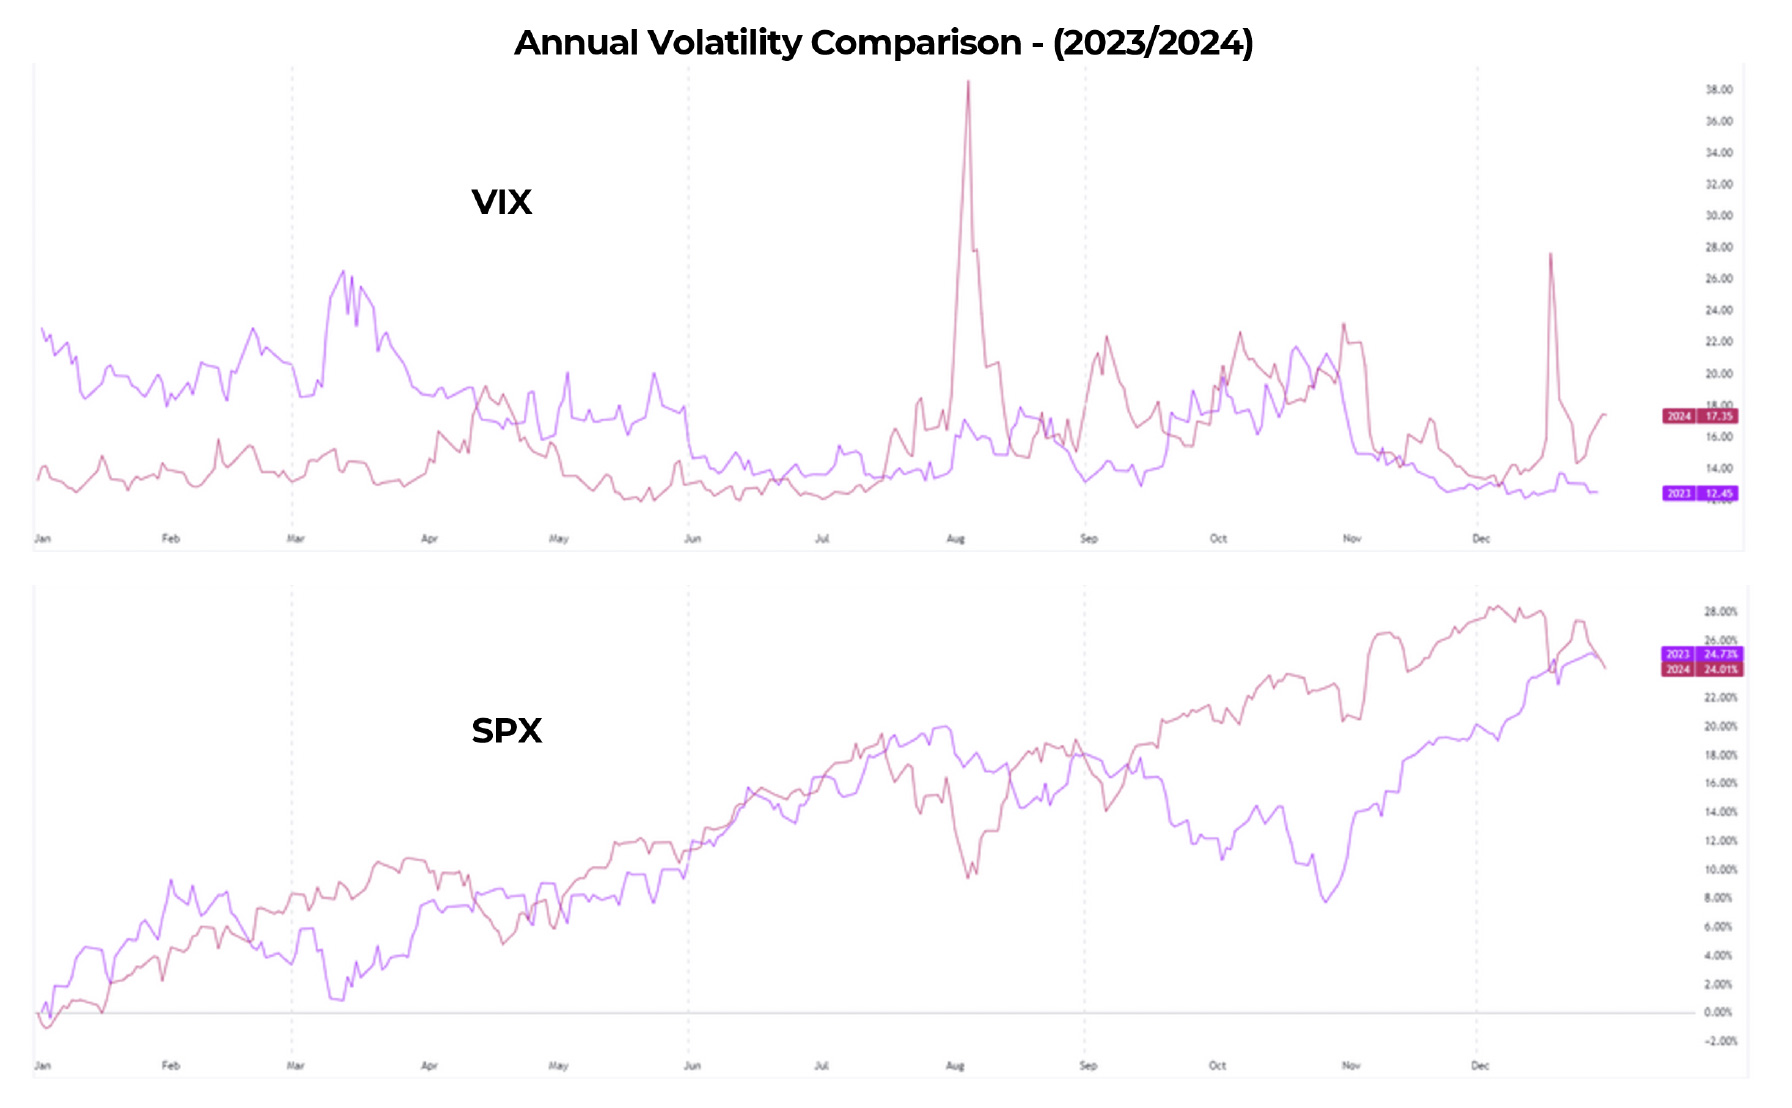
• Comparing volatility to the previous year (2023}, we can observe similarities in seasonal volatility where from August to November we see increased overall volatility and spikes in volatility.
• The beginning of the 2024 had lower volatility in comparison to 2023, where markets remained resilient in bullish posture, in the second half of the year volatility increased similarly as in 2023. Drops in the S&P and equity markets, likely attributed to adjustments in monetary policy and economic factors, saw higher overall volatility than 2023.
• Despite higher volatility, S&P returns were on par with 2023 performance, where downtrends and drops were quickly resolved to resume a strong bullish trend seen throughout the year. Disclosure
Implied Volatility
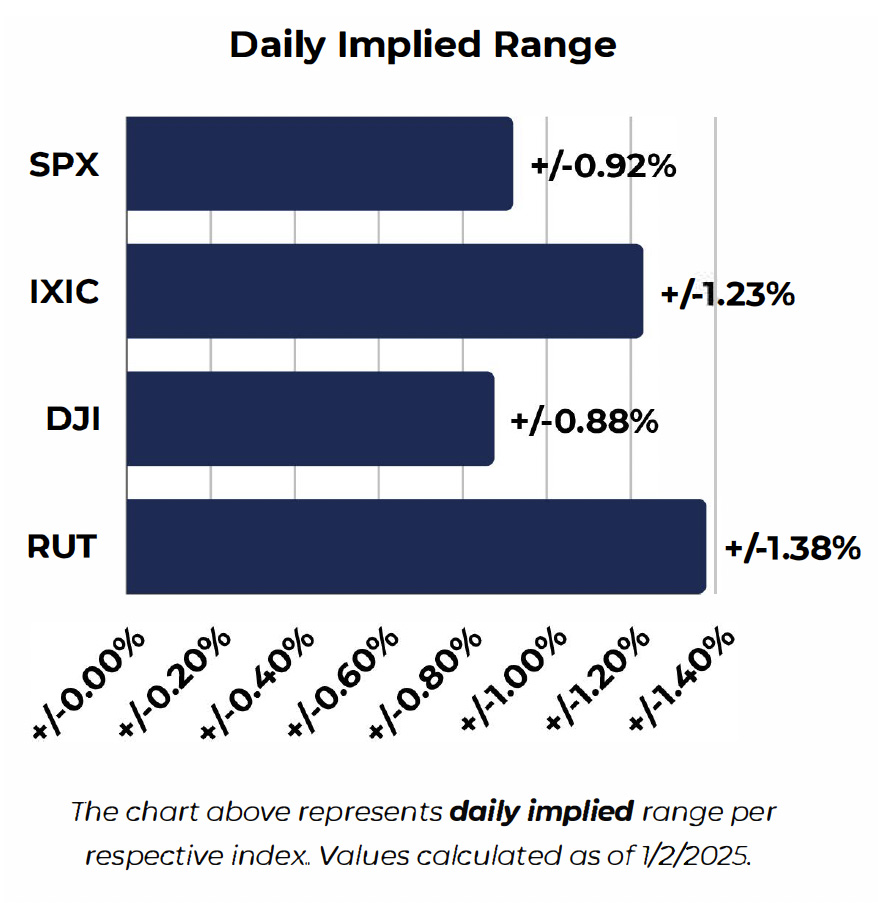
Looking at volatility in the major indices, the visuals above show underlying volatility index calculations to estimate daily implied ranges as well as 30-Day implied ranges. These are forward looking estimates.
Using the most recent volatility data for each respective index, daily implied range estimates daily price flucuations, in terms of percentage, expected for the following year. The Russel and Nasdaq are expected to have the highest volatility on a daily basis, over +/-1%. Followed by the S&P and Dow Jones just under 1%.
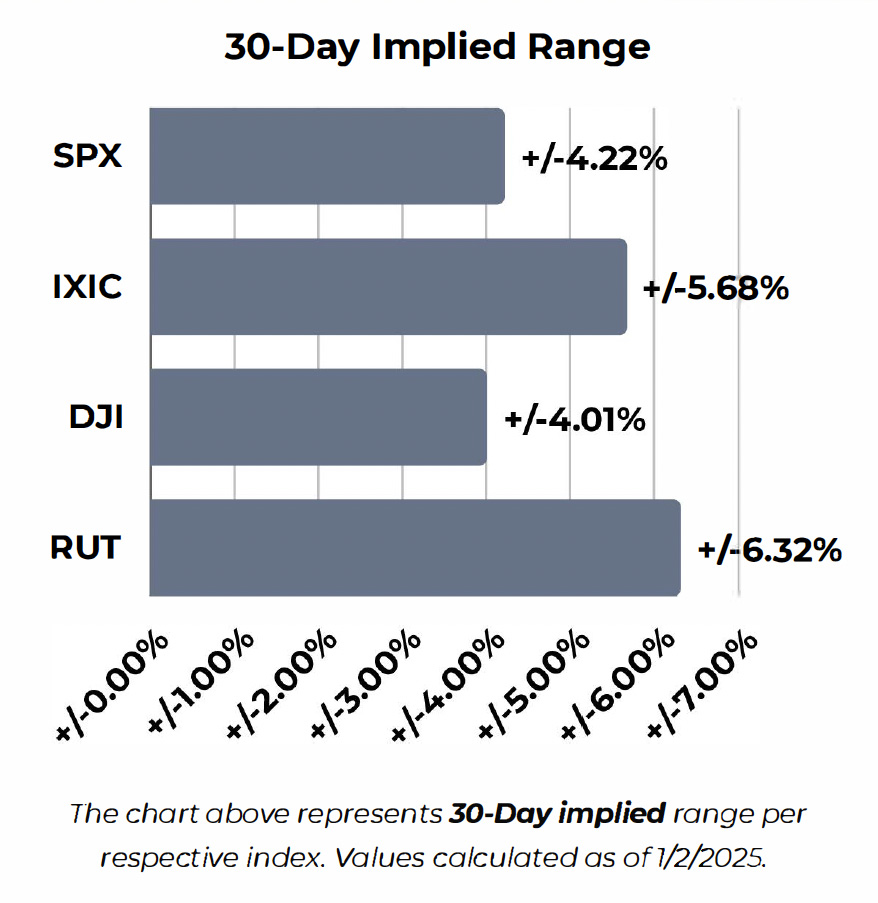
• Looking further out, in terms of 30-Day implied range, higher volatility on a one-month forward looking basis is seen in the Nasdaq (+/-5.68%} and the Russel (+/-6.32%}. The Dow and S&P 500 implied range is about +/-4%.
• Throughout 2024, the Russel and Nasdaq have been consistently the most volatile indices in comparison to their counterparts. Compared to implied volatility readings at the end of Q3, metrics remain mostly similar.
The implied 30-Day Range for all respective indices are included on the following pages for visual representation.
S&PSOO-SPX
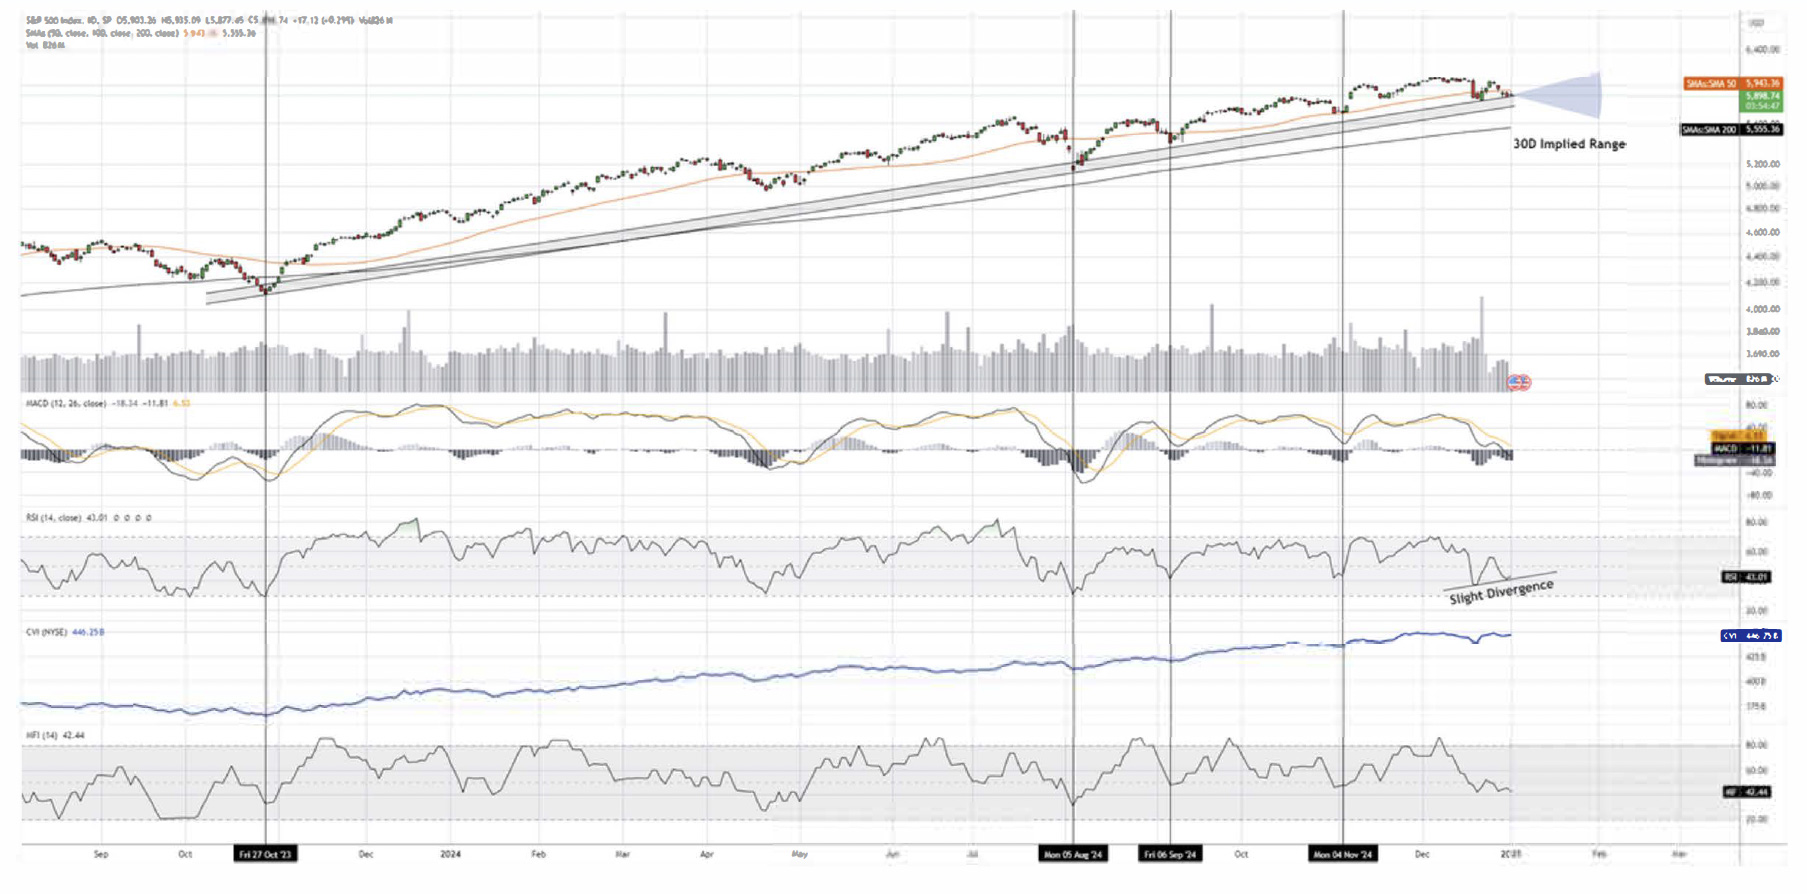
The S&P 500 closed at 5,881 for the final quarter of the year, posting a gain of +2.07% for the quarter, the second-best performing index behind the Nasdaq. For the year of 2024, the index was up +23.95%, beating its annual average of approximately 10%. Overall, the index has remained resilient for the year along its respective trend line seen above, despite a drop in recent weeks of nearly 5% from record highs, the index is finding support near the trend line that has been followed since October of 2023, a positive indication of continuing this technical trend. In the coming months we expect the index to retest the highs as well as make new highs in 2025. For the following 30 days, a retest of 6,100 is a probable outcome.
Key Technicals
• Support levels for the S&P are respectively between 5,800-5,850, followed by 5,550 at the 200-Day Moving Average if price moves below the trend line which is a low probability case scenario. Low values in the moneyflow index and RSI are seen recently, but we see multiple times highlighted above where this represented short-term bottoms in the S&P.
• A close above the SO-Day moving average (5,940) would show positive indication of bullish reversal in the short-term.
• Using retracement calculations, the next target for the S&P 500 would be near 6,275 in Ql-Q2 of 2025 .
Dow Jones Industrial Average - DJI
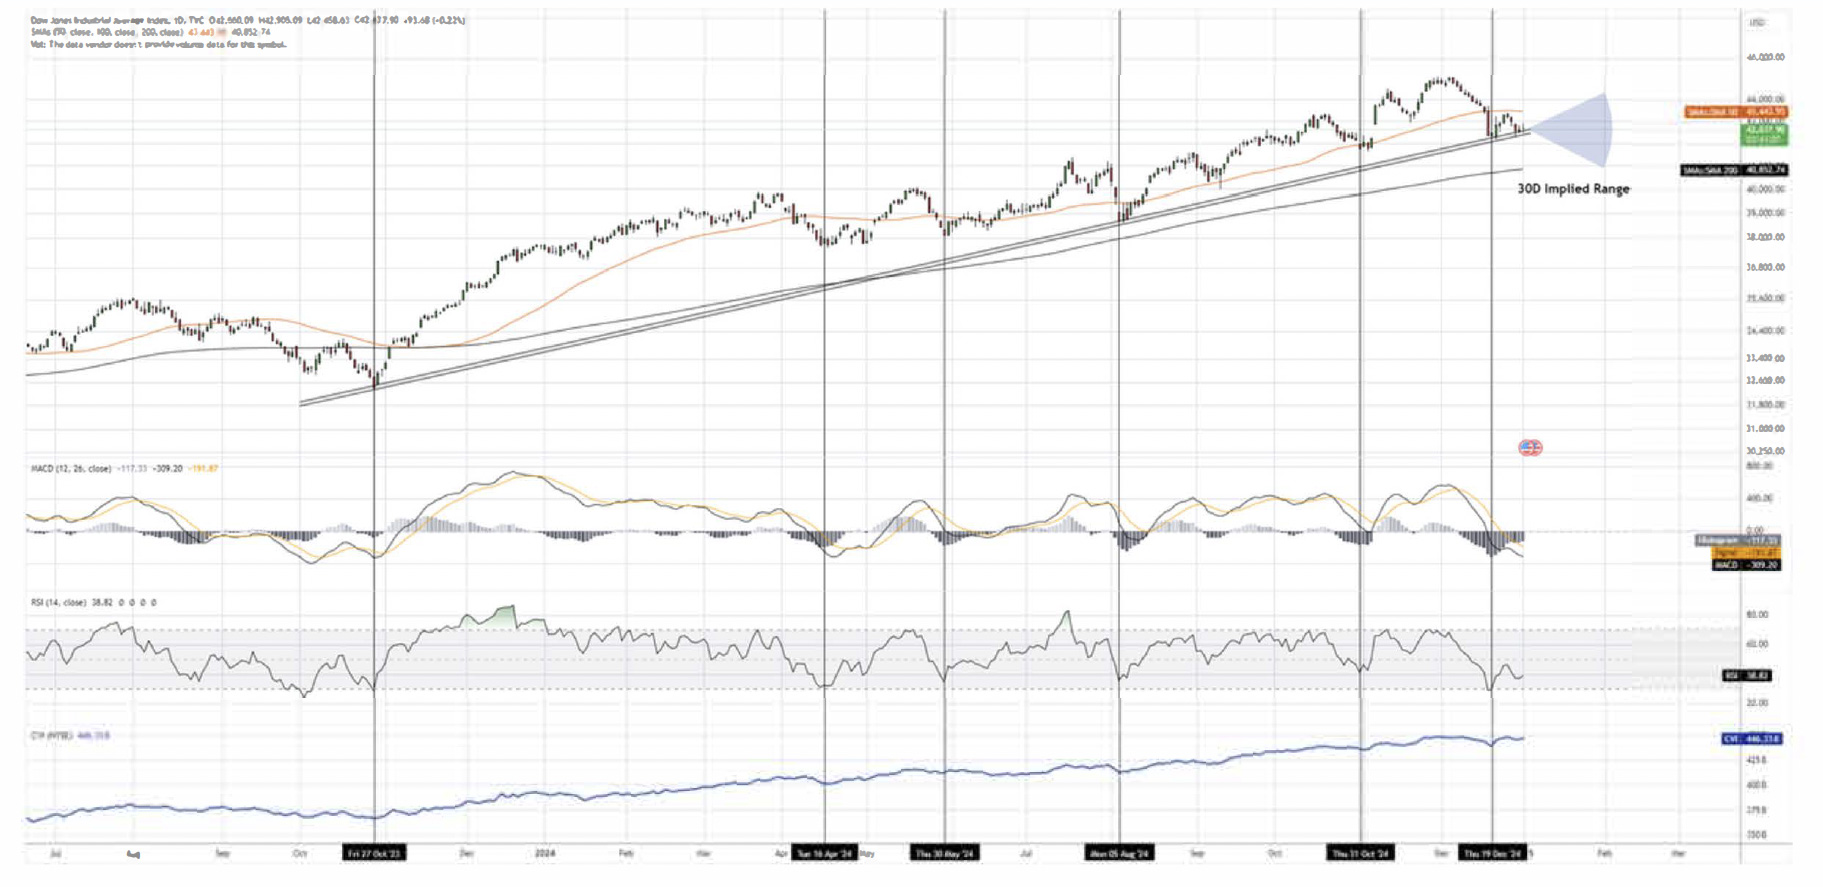
The Dow Jones finished the final quarter relatively flat at 42,544, posting +0.50% gains for Q4. Important to note that the recent sell-off for the Dow attributed to this below average quarterly performance, dropping over 6% from all-time highs. Overall, the index had a positive year in 2024, with net gains of +13.25%. Despite the recent decline in the index, similar to the S&P, support has been found along the long-term trend line respected since October 2023 seen above. We also expect the Dow Jones to eventually retest the all-time highs again but at a slower pace.
Key Technicals
• Support levels for the Dow are respectively 42,200 along the trendline, as well as 40,850 at the 200-Day moving average, yet a move to this level in unlikely in the short-term. A close above the SO-Day moving average (approximately 43,440) would be a positive indication that a reversal back to the upside is undergoing representing a change in momentum.
• The Dow Jones recently entered oversold territory as well as a dip in the MACD indicator, despite this, since Oct. 2023, oversold readings in the DJIA have represented buying opportunities on multiple occasions as highlighted above.
• Using retracement calculations, the next target for the Dow Jones would likely be near 46,200 in 2025.
NASDAQ Composite lndex-IXIC
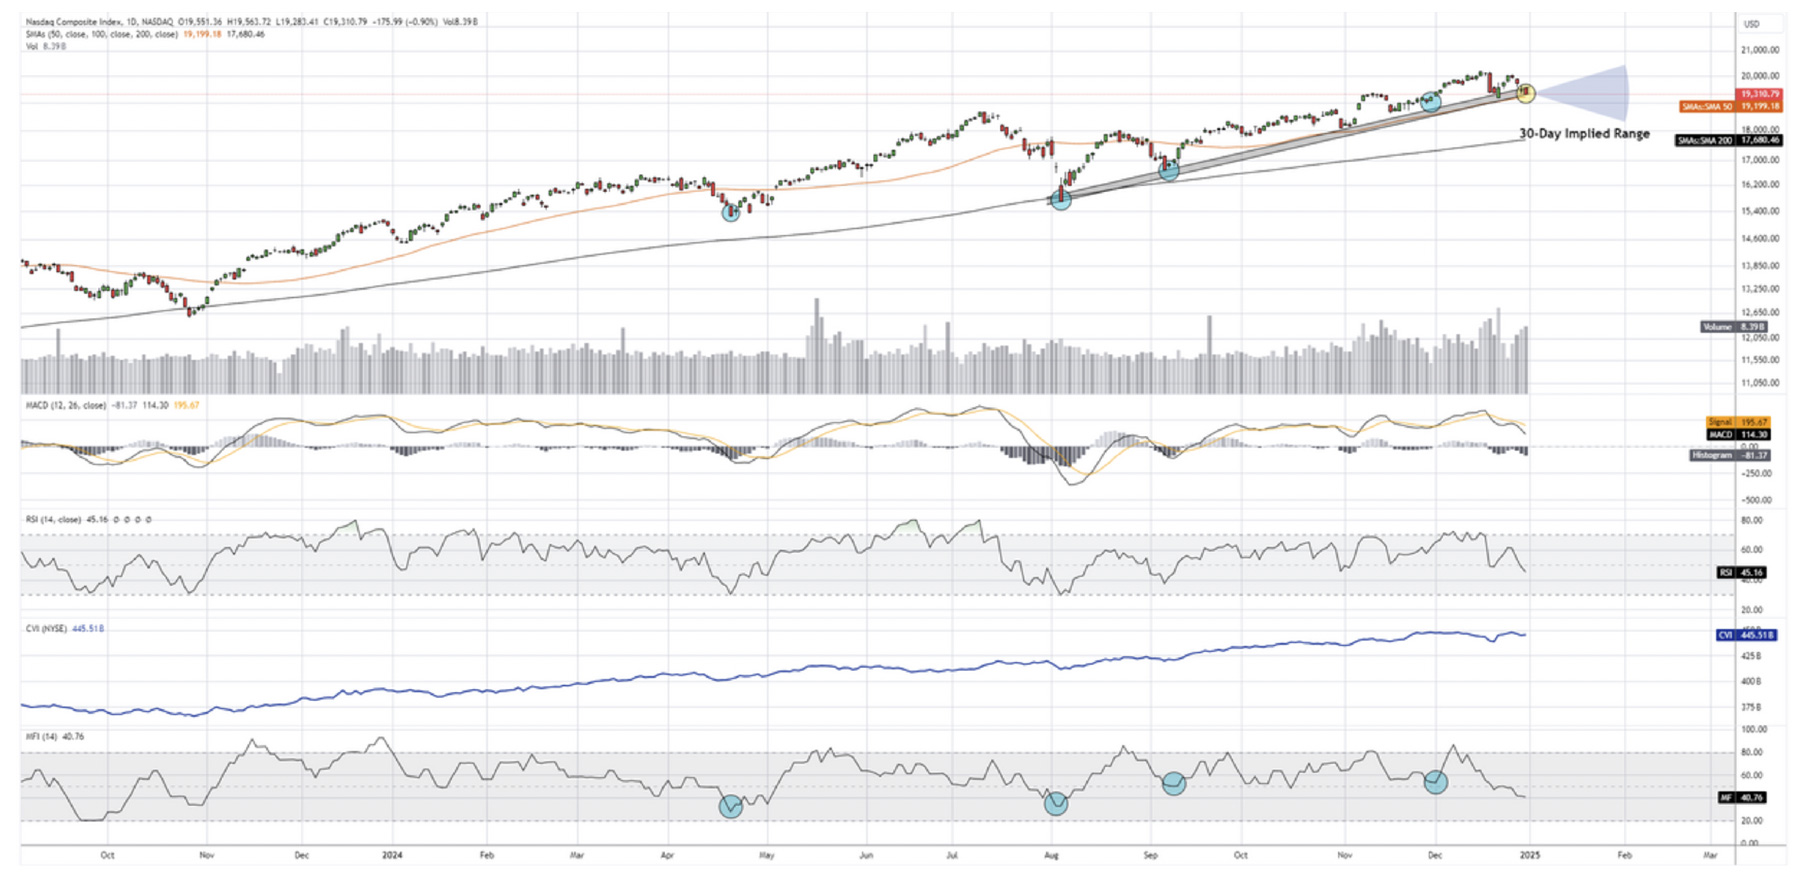
The Nasdaq closed at 19,310 as the best performing index, up +6.35% for Q4 and up 29.84% for 2024 in total. In recent weeks, the index declined approximately 5% from the all-time highs as profit taking occurred near the end of the year. The Nasdaq has been the most volatile index this year yet remains in strong bullish posture as reversals along the major trend line have yet to fail since August of this year. With this observation and the technical nature of this trend, the index is likely to reverse upwards from current levels as well as retest its highs, similar to the other indices.
Key Technicals
• Support zones for the Nasdaq are the 19,200 which represents support at both the SO-Day moving average and along the upward sloping trend line. The SO-Day MA has acted as a key support area throughout 2024.
• A decline in value in both the moneyflow index and RSI are representative of recent decline, but historically the index has reversed positively when nearing oversold levels and money flow declines to lower levels.
• Using retracement calculations and in consideration of the Nasdaq's volatility, the next target for the index would be near 20,650-21,000 in 2025.
Russel 2000 Index - RUT
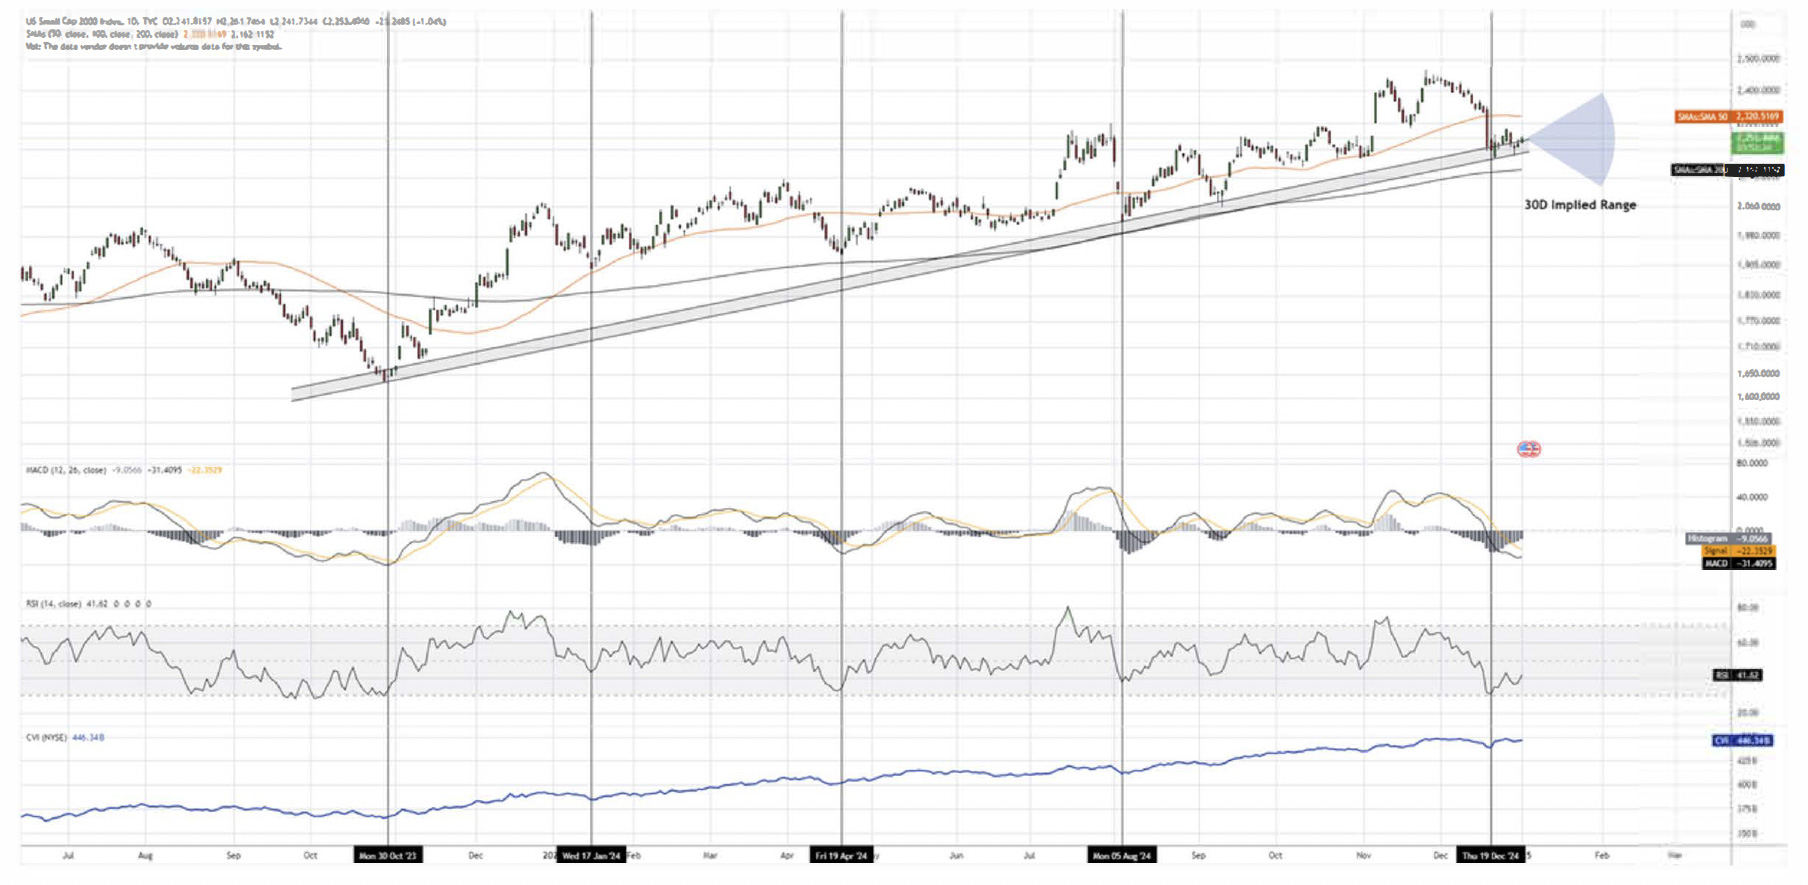
The Russel 2000 closed the fourth quarter practically flat, up +0.01% from Q3's close. For the 2024 year, the index was up +10.84%. Similar to all other major indices, the recent decline in equity markets saw the Russel drop nearly 11% from the highs of this year attributing to its flat performance for the quarter. Small capitalized equities still had a positive year, and as the Russel sits along the major trend line, a bullish reversal from current levels is a likely scenario. The Russel currently has the highest implied volatility in comparison to other indices, and is trading just above its 200-Day Moving Average. A retest of the highs in the coming months is a reality for the Russel as the sharp recent decline created an oversold territory.
Key Technicals
• Support zones for the Russel are near 2,200 along the trend line seen above, with the 200-Day Moving average also acting as support at the 2,160 area. A close above the SO-Day moving average (2,320} would be indication of bullish continuation.
• RSI entered the oversold area and is showing reversal from the low reading, while MACD is also hinting at a reversal in momentum in the short-term. Oversold readings highlighted above have historically shown bullish reversals for the index.
• Using retracement calculations, the next target for the Russel would be near 2,550 for 2025.
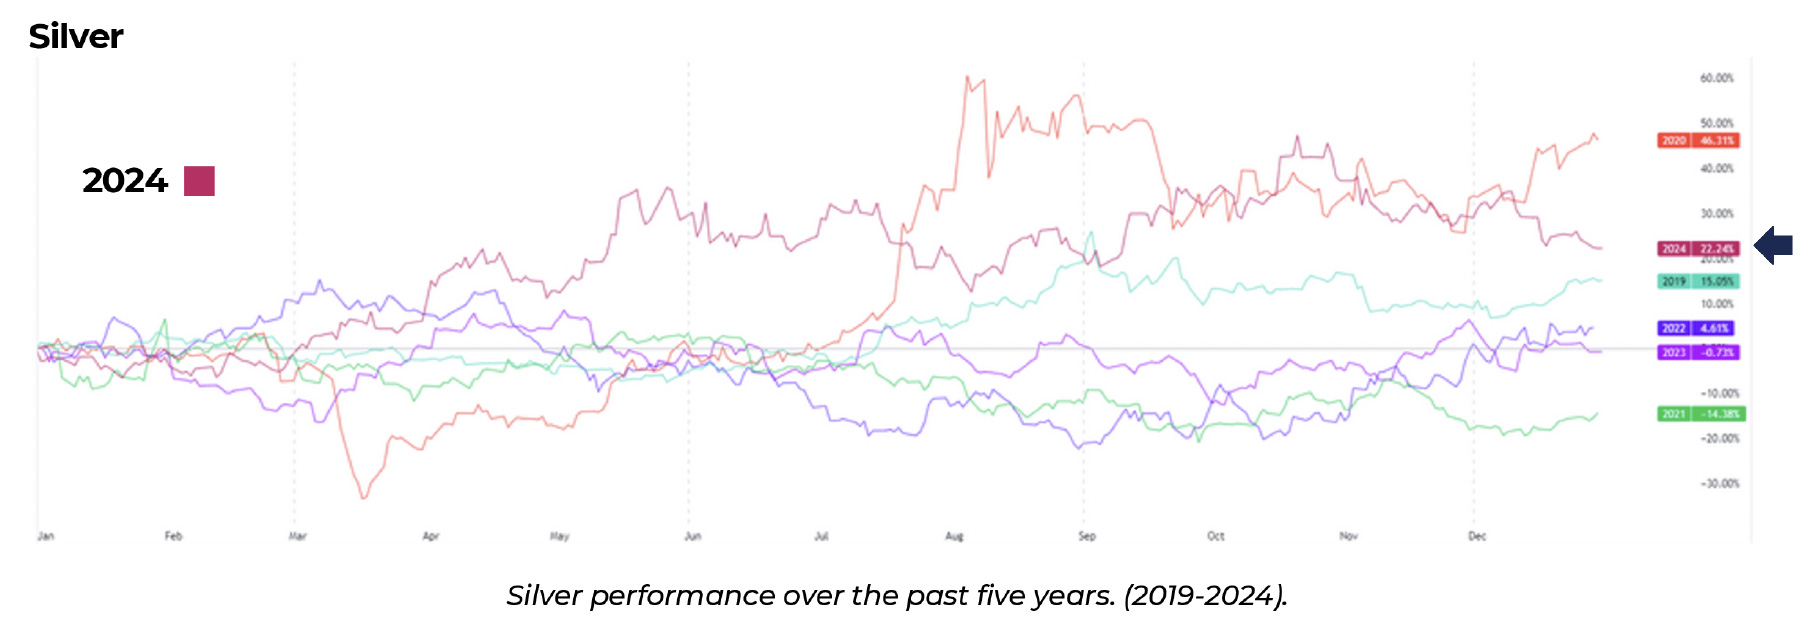
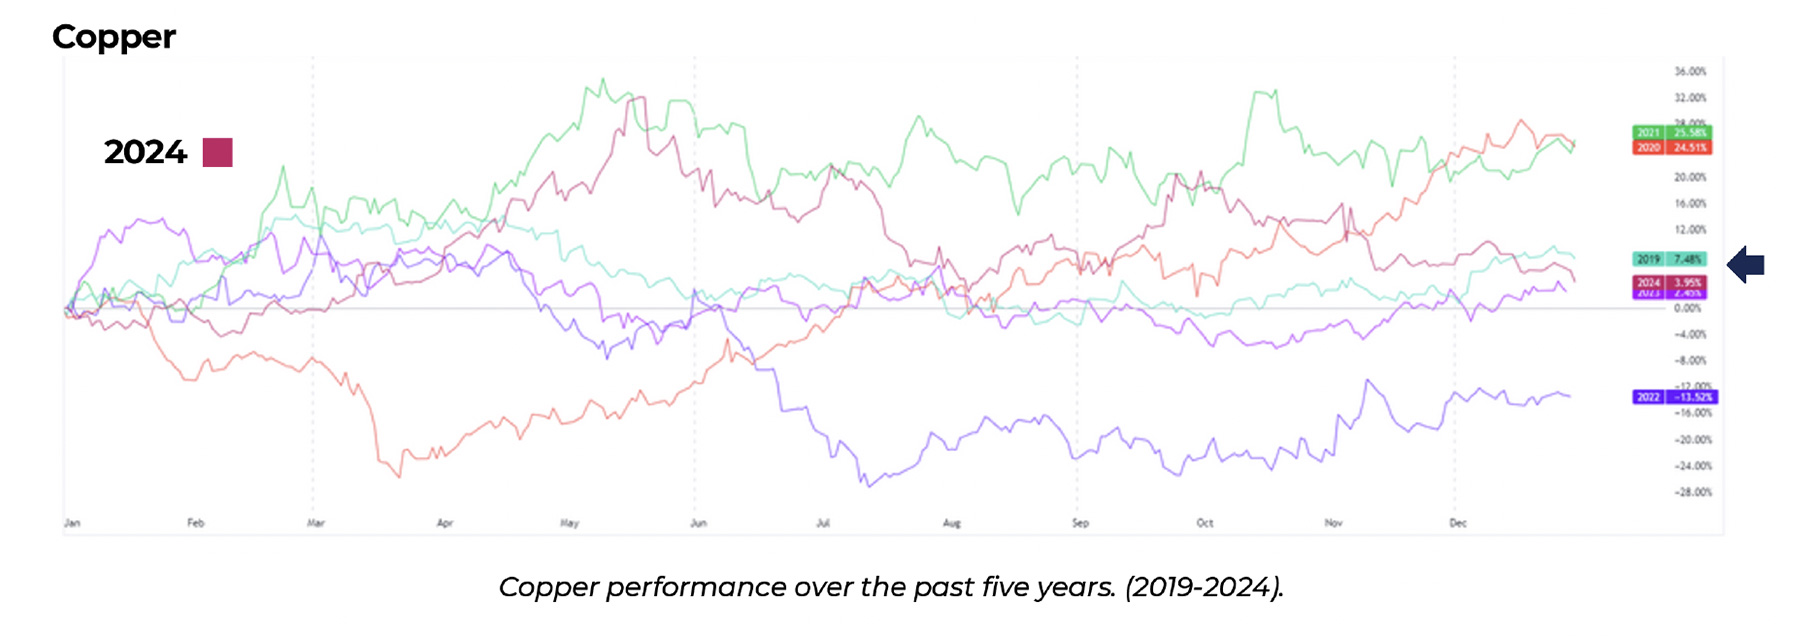
Precious Metals
Other than equity index performance, precious metals, specifically Gold and Silver had noteworthy performance in 2024.
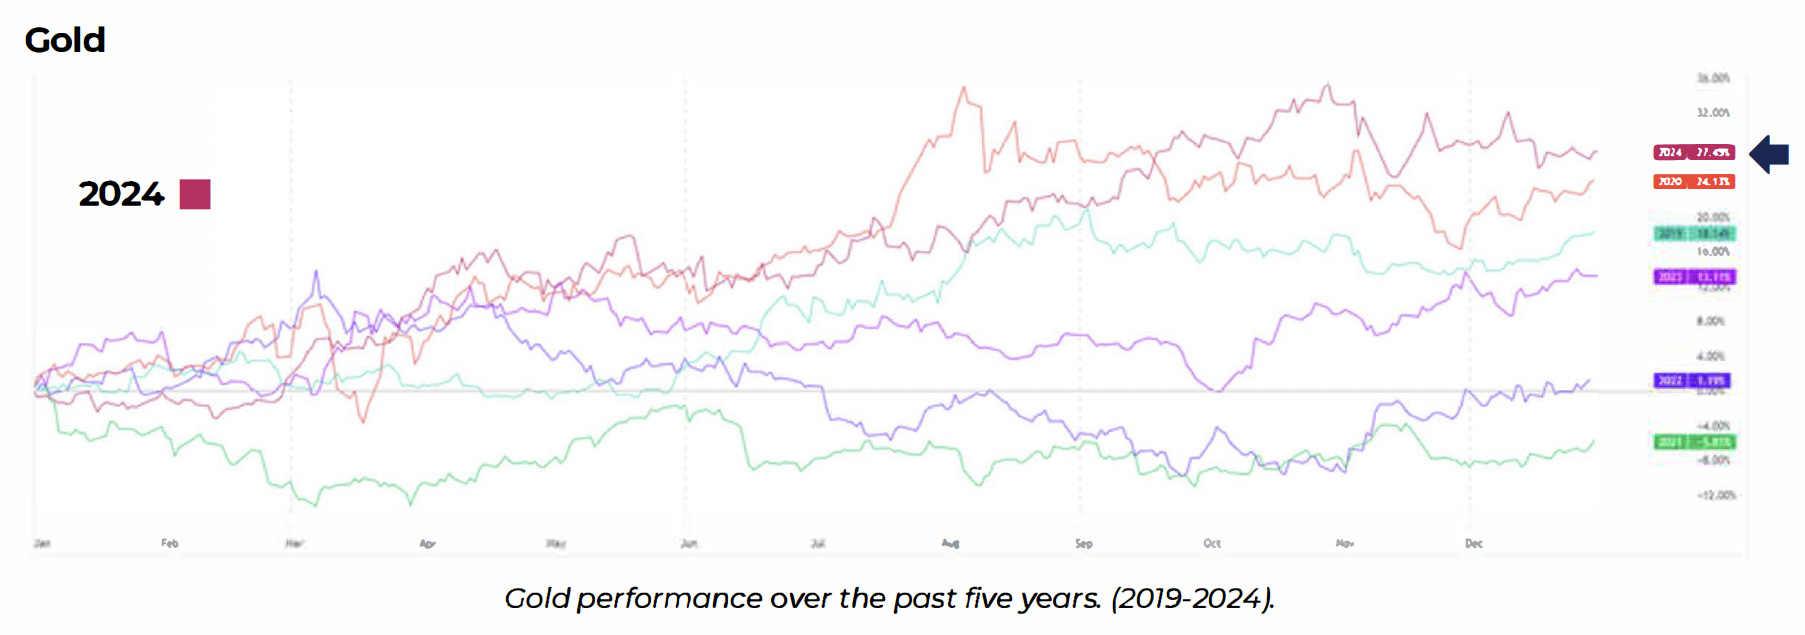
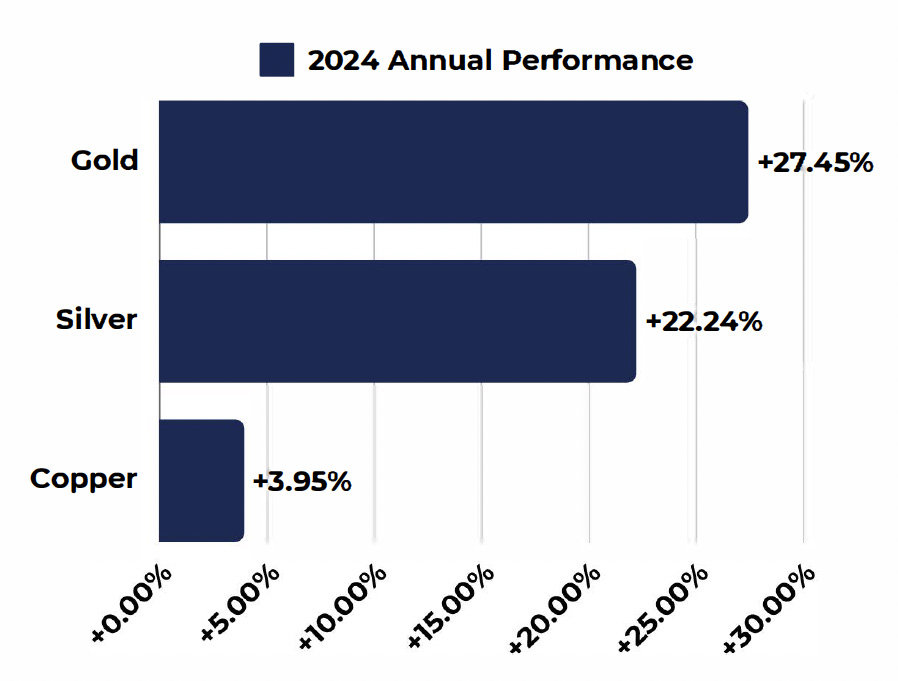
• Gold finished the year at $2,624/oz, with annual gains of 27.45%, the best annual performance for Gold in the past five years. We expect gold prices to continue its trend in 2025, as retests of $2,800 are likely.
• From a technical perspective, both Gold and Silver have potential for continued momentum to the upside.
• Silver also had a positive year, with annual performance of 22.24%, closely following its counterpart.
• Copper closed with annual gains of 3.95%, slightly higher than 2023's performance.
• Catalysts for the metals in 2025 include changes in monetary, economic, and fiscal policy, the direction of the U.S. Dollar, and industrial usage, all key drivers.
Sentiment Statistics
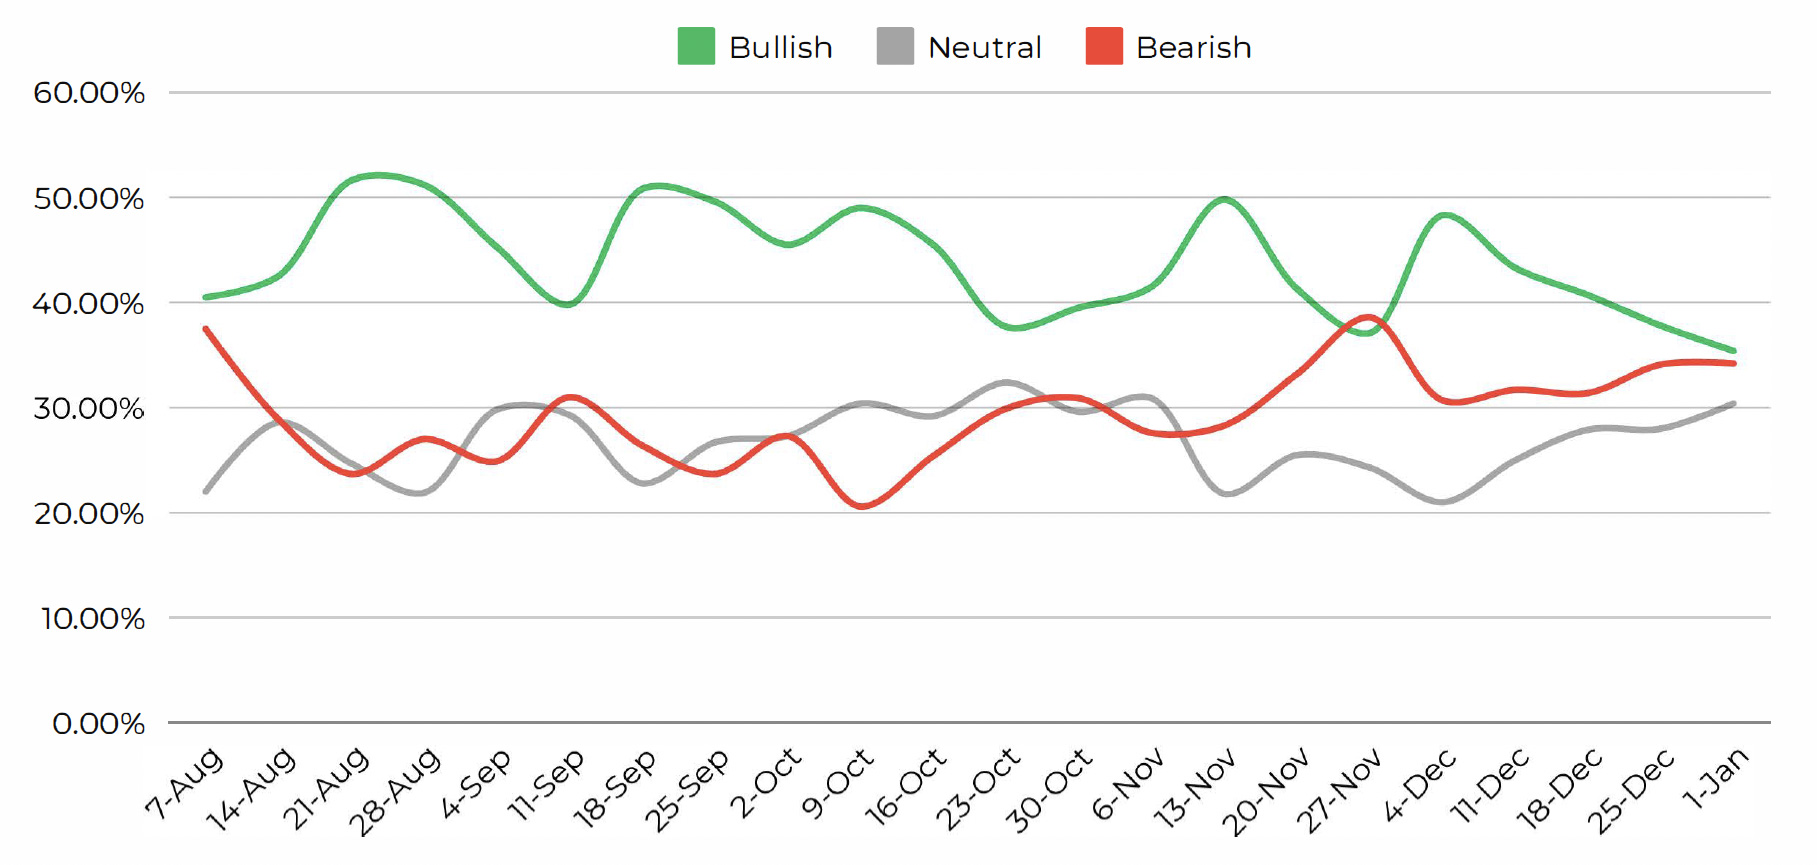
The chart above is a collection of weekly sentiment readings from the American Association of Individual Investors (AA/I}, gauging investors outlook on equity markets for the following 6 months. www.aaii.com/sentimentsurvey
Looking at other key metrics that measure sentiment and momentum, the most recent sentiment survey (conducted on l/1/25} shows investor confidence is relatively neutral and split for the end of the year. Despite bullish investor confidence dropping since the beginning of December, historically, high neutral sentiment, combined with increased bearish sentiment often results in positive reactions within equity markets.
Similar to the end of October in 2024 where sentiment from all three sentiment readings converged (bullish readings dropped, while bearish and neutral readings increased). markets reacted prompted with a strong rally in November and December where most indices reached new all-time highs.
Market Momentum Statistics
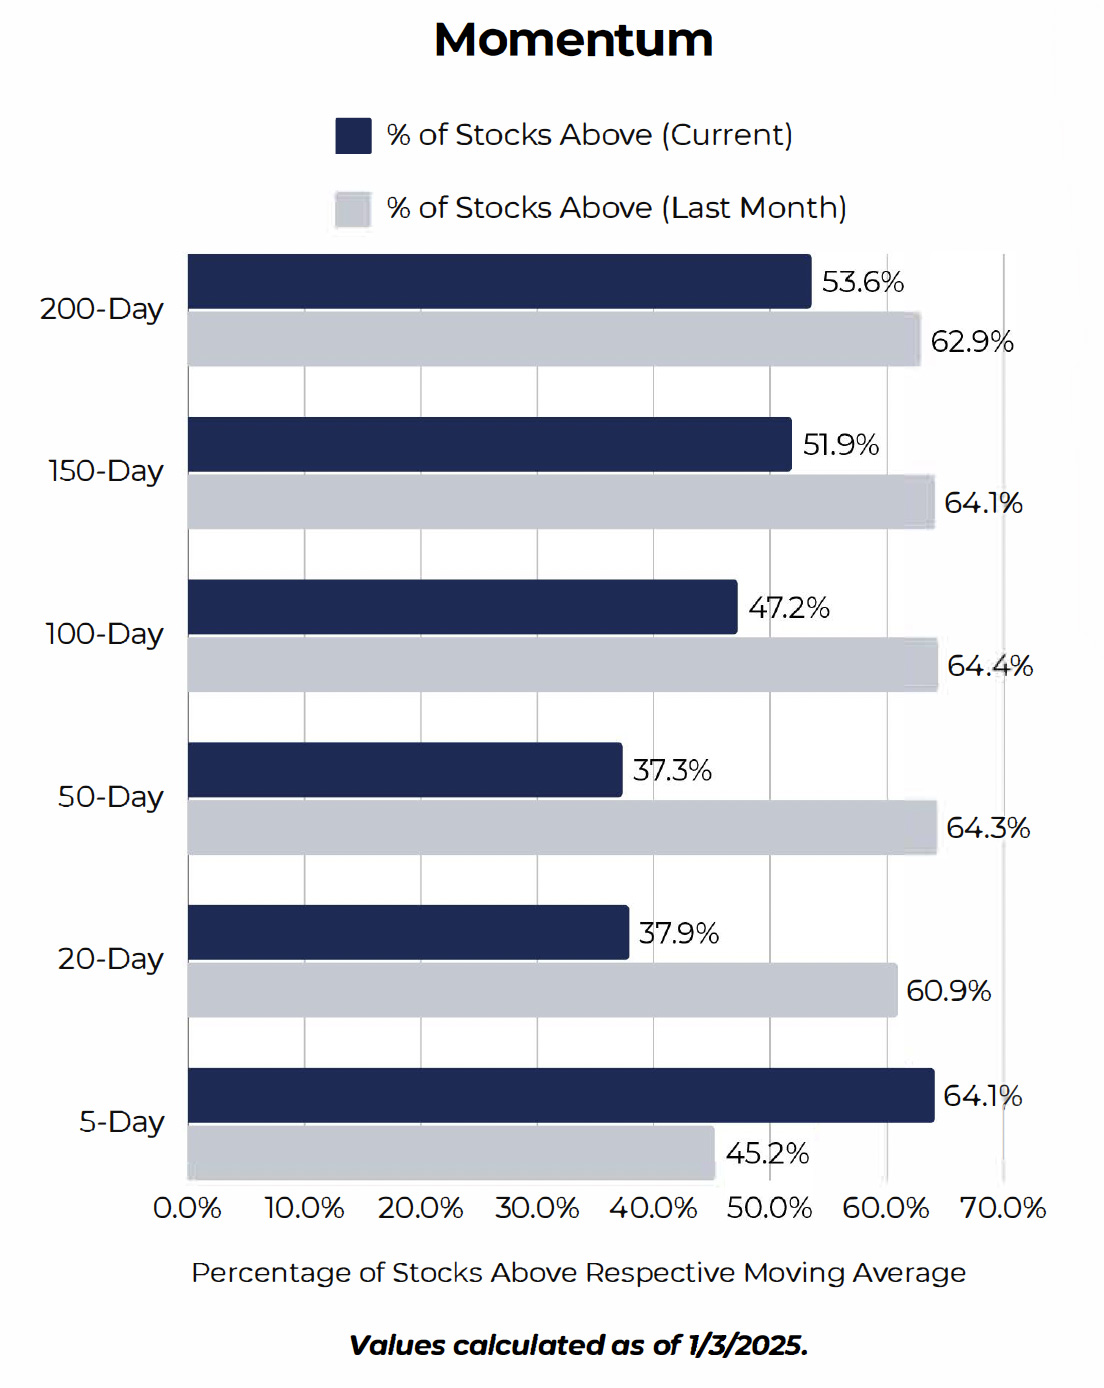
Included on the left are percentages of stocks that remain above their respective moving averages. In order to further gauge market internals, we can compare the most current reading to data from the prior month. When high percentages of stocks are above their respective moving averages, it is a positive sign of momentum.
• Momentum in the long-term averages have slightly declined, but a majority of stocks still remain above their 200-Day moving average despite a sharp decline for equities in recent weeks.
• We see that stocks above their 5-Day moving average are beginning to gain momentum again in comparison to a month ago.
• For continued bullish reversal, a technical indication of momentum shifting back upwards would be observing a higher percentage of stocks trading above their 20 and SO-Day moving averages in the nearterm.
Disclosure
This report has been prepared as a matter of general information regarding market conditions. The information provided here is for general informational purposes only and should not be considered an individualized recommendation or personalized investment advice. The information mentioned here may not be suitable for or in the best interest of everyone. Clients should consider an investment strategy for his or her own situation before making any investment decision and if appropriate, seek professional advice, including legal or tax advice.al views.
l. The views expressed herein accurately reflect personal views. All expressions of opinion are subject to change without notice in reaction to shifting market conditions. All statistics and data contained herein are from sources considered to be reliable. However, its accuracy, completeness, or reliability cannot be guaranteed.
2. This is not an offer to sell securities or the solicitation of an offer to buy securities, nor shall there be any sale of securities in any jurisdiction in which such offer, solicitation or sale would be unlawful prior to registration or qualification under the securities laws of such jurisdiction.
3. Investing involves risk, including loss of principal. Past performance is no guarantee of future results.
4. The information is deemed to be defined as Technical Analysis and is not defined as a Research Report under FINRA Rule 2241.
45 Broadway, 19th Floor New York, NY 1006 | Tel 212 293 0123 | 877 772 7818 | Fax 212 785 4565
www.spartancapital.com | Member of Finra | SIPC | MSRB Registered